i2MassChroQ User Manual
- Preface
- 1 Generalities
- 2 Fundamentals in Bottom-up Proteomics
- 3 The main program window
- 4 Exploring identification data
- 5 Exploring post-translational modification data
- 6 Advanced Proteomics Configurations
- 7 i2MassChroQ and Quantitative Proteomics
- 8 Specific procedures for the timsTOF line of instruments
- A GNU General Public License version 3
2 Fundamentals in Bottom-up Proteomics
This chapter is an optional chapter which the reader might be referred to upon reading other part of this manual.
2.1 The Protein Biopolymer: Structure and Chemistry #
This section introduces the basics in protein polymer chemistry. The way this topic is going to be covered is admittedly biased towards mass spectrometry and proteins. Moreover, the aim of this chapter is to provide the reader with the specialized words that will later be used to describe and explain the (inner) workings of the i2MassChroQ program. This manual is not a “crash course” in biochemistry.
2.1.1 Protein Biosynthesis #
Proteins are made of amino acids. There are twenty major amino acids in nature, and each protein is made of a number of these amino acids. The combinations are infinite, providing enormous diversity to the protein realm.
A protein is a polar polymer: it has a left end and a right end, and polymerization actually occurs from left to right (from N-terminus to C-terminus, see below). Figure 2.1, “Peptidic Bond Formation by Condensation” shows that the chemical reaction at the basis of protein synthesis is a condensation. A protein is the result of the condensation of amino acids with each other in an orderly polar fashion. A protein has a left end, called N-terminus; amino-terminal end and a right end, called C-terminus; carboxy-terminal end. The left end is an amino group (2HN–) corresponding to the non-reacted α-amino group of the very first amino acid of the protein sequence. Upon condensation of a new entering amino acid onto the first N-terminal one, the amino group of the entering amino acid reacts (nucleophilic attack) with the α-carboxyl group of the N-terminal amino acid. A water molecule is released, and the formation of an amide bond between the two amino acids yields a dipeptide. The right end of the dipeptide is a carboxyl group (–COOH) corresponding to the un-reacted α-carboxyl group of the last amino acid to have been “polymerized in”.
The bond formed by condensation of two amino acids is an amide bond, also called—in protein chemistry—a peptidic bond. The elongation of the protein is a simple repetition of the condensation reaction shown in Figure 2.1, “Peptidic Bond Formation by Condensation”, granted that the elongation always proceeds in the described direction (a new monomer arrives to the right end of the elongating polymer, and elongation is done from left to right).
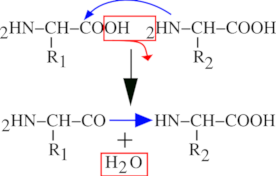
The left end monomer R1 is condensed to the right end monomer R2 to yield a peptidic bond. A water molecule is lost during the process.
Figure 2.1: Peptidic Bond Formation by Condensation #
Note
Now we should point at a protein chemistry-specific terminology issue: we have seen that a protein is a polymer made of a number of monomers, called amino acids. In protein chemistry, there is a subtlety: once an amino acid has been polymerized into a protein, it is no more called an amino acid, but is called a residue instead. We may say that a residue is an amino acid less a water molecule.
From what we have seen until now, we may define a protein this way: —“A protein is a chain of residues linked together in an orderly polar fashion, with the residues being numbered starting from 1 and ending at n, from the first residue on the left end to the last one on the right end”. This definition is still partly inexact, however. Indeed, from what is shown in Figure 2.2, “End Capping Chemistry of the Protein Polymer”, there is still a problem with the extremities of the residual chain: what about the amino group on the left end of a protein (the amino group sits right onto the first amino acid of the protein), and what about the carboxyl group of the right end of a protein (the carboxyl group sits right onto the last amino acid of the protein)? Because these groups lie at the extremities of the residual chain, they remained unreacted during the polymerization process. But because we are simulating a residual chain using residues and not amino-acids, we still need to put the protein polymer molecule in its “finished state”: by capping the left end with a proton cap (so as to complete the amino group) and the right end with a hydroxyl cap (so as to complete the carboxyl group). The capping of the residual chain extremities ensures that the polymer is in its finished state, and that it cannot be elongated anymore. The proton is the left cap of the protein polymer and the hydroxyl is the right cap of the protein polymer.
A protein is made of a chain of residues and of two caps. The left cap is the N-terminal proton and the right cap is the C-terminal hydroxyl. Altogether, the residual chain (enclosed here in the blue polygon) and both the H and OH red-colored caps do form a complete protein polymer in its finished state.
Figure 2.2: End Capping Chemistry of the Protein Polymer #
Now comes the question of unambiguously defining the structure of a protein. It is commonly accepted that the simple ordered sequence of each residue code in the protein, from left to right, constitutes an unambiguous description of the protein's primary structure (that is, its sequence). Of course, proteins have three-dimensional structures, but this is of no interest to a program like massXpert, which is aimed at calculating masses of polymers. To enunciate unambiguously the sequence of a protein, one would use a symbology like this:
Using the 3-letter code of the amino acids:
Ala Gly Trp Tyr Glu Gly Lys
Using the 1-letter code of the amino acids:
A G W Y E G K
Alanine is thus the residue 1 and Lysine is the last residue (n = 7)
2.1.2 Protein Disrupting Chemistries #
The “polymer chain disrupting chemistry” was mentioned earlier as a complex subject that was of enormous importance to the mass spectrometrist. This is why that subject will be treated in a pretty thorough manner. First of all it should be noted that a chemical modification of a polymer does not necessarily involve the perturbation of the chain structure of the polymer. Here, however, we are concerned specifically with a number of chemical modifications that yield a polymer chain perturbation; cleavages and fragmentations:
Cleavages. These are chemical processes by which a cleaving agent will act directly on the protein residual chain making it fall into at least two separated pieces (the peptides).
Fragmentations. These are chemical processes by which the polymer structure is disrupted into separated pieces (the product ions, or fragments) mainly because of energy-dependent electron doublet rearrangements leading to bond breakage.
2.1.2.1 Protein Cleavage #
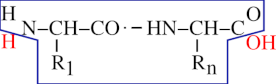
Upon cleavage of a protein, the cleaving molecule reacts with it, and by doing so directly or indirectly “dissolves” an inter-residue bond. A protein cleavage always occurs in such a way as to generate a set of true finished polymerization state “proteins” (smaller in size than the parent polymer, evidently, which is why they are called oligopeptides, or peptides). Indeed, let us take the example shown in Figure 2.3, “Protein Cleavage by Water and Cyanogen Bromide”, where a tripeptide (a very little protein, containing a methionyl residue at position 2) is submitted either to a water-mediated cleavage (hydrolysis, upper panel) or to a cyanogen bromide-mediated cleavage (lower panel). The two cases presented in this figure are similar in some respects and different in others:
In the first case the molecule that is responsible for the cleavage is water, while in the second case it is cyanogen bromide;
In both cases the bond that is cleaved is the inter-monomer bond (in protein chemistry this is a peptidic bond);
In both cases the Oligomer 2 has the same structure;
The structures of the Oligomer 1 species differ, when produced using water or cyanogen bromide as the cleaving molecule.
The difference between hydrolysis and cyanogen bromide cleavage is in the generation of the Oligomer 1 species: the cyanogen bromide cleavage has a side effect of generating a homoseryl residue at the C-terminus of Oligomer 1, while hydrolysis generates a genuine methionyl residue. This is because water reverses in a very symmetrical manner what polymerization did (hydrolysis is the converse of condensation), while cyanogen bromide did some chemical modification onto the generated Oligomer 1 species.
A tripeptide is cleaved at position 1 either by hydrolysis (top) or by cyanogen bromide (bottom). Cyanogen bromide cleaves specifically on the right of a methionine monomer. Upon cleavage, the methionyl monomer gets converted into homoserine by the cyanogen bromide reagent
Figure 2.3: Protein Cleavage by Water and Cyanogen Bromide #
Nonetheless, the reader might have noted that—interestingly—all the four oligomers do effectively have their left cap (the proton, making the N-terminal amino group) and their right cap (the hydroxyl, making the C-terminal carboxyl group). This means that in both water- and cyanogen bromide-mediated cleavages, all the generated oligomers are indeed true polymers in the sense that: 1) they are a chain of residues (modified or not) and 2) they are correctly capped (i.e. they are polymers in their finished polymerization state). This is important because it is the basis on which we shall make the difference between a cleavage process and a fragmentation process. Thus, our definition of a peptide might be: a peptide is a protein (of at least one residue) in its finished polymerization state that was generated upon cleavage of a longer protein. Of course, when we use the term “protein”, above, we mean “protein polymer”, irrespective of its size.
When the protein cleavage reaction precisely reverses the reaction that was performed for the same protein's biosynthesis, there is no special difficulty. But when the cleavage reaction modifies the substrate, then this should be carefully taken into account when using i2MassChroQ. This is true for any chemical modification that happens onto a protein.
Well, all this sounds reasonable. But what about the “normal” case, when the cleavage is done using water? Nothing special: the mass of the oligomer is calculated by summing the mass of each monomer in the oligomer (since the monomers are not modified, this is easily done) and the masses corresponding to the left and right caps (these are defined in the polymer chemistry definition; in our present case it would be a proton on the left end, and a hydroxyl on the right end). In this way, the oligomer complies with its definition, which states that it is a faithful polymer made of monomers and that it is in its finished state.
Yes, but then how should one calculate the mass of the modified oligomer, like our Oligomer 1 in the case of the cyanogen bromide-mediated cleavage? Simple enough: in a first step it does exactly the same way as for the unmodified oligomer. Next, each oligomer is checked for presence or absence of a methionine residue on its right end. If a methionine is found, the mass corresponding to the “-C1H2S1+O1” chemical reaction is applied. And that's it.
2.1.2.2 Protein Fragmentation #
In a fragmentation process, the bond that is broken does not necessarily yield smaller-sized “proteins” because fragmentation does not necessarily break the inter-residue bond the same way that the hydrolysis does. Indeed, fragmentations are oft-times high energy chemical processes that can affect peptidic bonds at different locations, not necessarily between the CO-NH bond of the peptidic bond. This is one of the reasons why fragmentations do differ from cleavages.
Another peculiarity of fragmentations, compared with cleavages, is the fact that there is no cleaving molecule starting the process, like water or cyanogen bromide, for example. Indeed, in the gas phase, the peptidic ions are “isolated”: that is, very far one from each other. A fragmentation process is often initiated by an intra molecular electron doublet rearragement that propagates more or less in the polymer structure to eventually break it. Fragmentations are mainly a gas phase process, not some reaction that happens in solution as a result of putting in contact the polymer and some reagent. It is precisely because no cleaving molecule is involved in the fragmentation process that the obtained fragments are not necessarily capped like a normal polymer should be; and this is another really important difference between cleavage and fragmentation. The following examples should illustrate these concepts.
Tip
For the sake of completeness of this section, it must be noted that it is possible to have other “chemical/physical entities” intervene during the gas phase fragmentation process by enacting a chemical reaction, be these entities ions, electrons or photons. In bottom-up proteomics, the intervening molecules are gas molecules (nitrogen, most often, or helium) that act as physical entities imposing collisions to the peptidic ions with the effect that the ions acquire internal energy, eventually leading to dissociation (CID, for “collisionally-activated dissociation”).
There is a pretty important number of different kinds of fragments that can be generated upon fragmentation of peptides. We are going to detail the most common ones.

An hexapeptide is fragmented in the seven most widely encountered manners, such as to generate product ions of the a, b, c, x, y, z series and also immonium ions. The figure illustrates the position of the bond dissociation for each kind of fragment (exemplified using the case of the smallest fragment possible) and the mass calculation method is described for each fragment kind; consider that each fragment bears only one positive charge.
Figure 2.4: Protein fragmentation patterns most widely encountered #
As can be seen from Figure 2.4, “Protein fragmentation patterns most widely encountered”, the fragmentations do generate fragments of three categories: the ones that include the left end of the precursor polymer (a, b, c), the ones that include the right end of the precursor polymer (x, y, z), and finally the special case in which the fragment is an internal fragment, like the immonium ions. When looking at the fragmentations described in the figure, it becomes immediately clear why a fragmentation cannot be mistaken for a cleavage: the ionization of the fragment is not necessarily due to the captation of a proton by the fragment. Furthermore, we can also see that a fragmentation is not a cleavage because the fragment that is generated is absolutely not necessarily what we call a polymer, in the sense that the fragment might not be capped the same way as the precursor protein/peptide is (that is, the fragment is not in its finished polymerizaton state).
By looking at Figure 2.4, “Protein fragmentation patterns most widely encountered”, the reader should have noticed that the fragment naming scheme takes into consideration the fact that the fragment bears the N-terminal or C-terminal end of the precursor peptide (or none, also). Indeed, the numbering of fragments holding the N-terminal end of the precursor polymer sequence begins at the left end, and for fragments that hold the C-terminal end, at the right end. Thus the third fragment of series a (a3) would involve monomers [1→] and the third fragment of series y (y3) would involve monomers [6→] (see arrows in the figure).
2.2 General Overview of Bottom-up Proteomics #
Bottom-up proteomics is a field of endeavour where the ultimate goal is to identify the greatest number of proteins in a given sample. This goal might also, depending on the project at hand, be doubled with another goal: characterize at the finest level possible the nature and the position of post-translational/chemical modifications beared by the proteins.
To achieve the best results, proteomics has developed over the years a number of methods and techniques that, taken together, have allowed scientists to obtain impressive results of protein identification on pretty complex samples. These are listed below:
Mass spectrometers: The development of mass spectrometers of ever-greater resolution power has allowed to attain at ever-lower false discovery rates over the years. In particular, the development of the Orbitrap analyzers, along with the huge improvements of the time-of-flight (TOF) mass analyzer technology, have strongly increased the identification results reliability by allowing the downstream data processing step to be more stringent in the protein identification task (see below);
Chromatography: The development of highly resolutive chromatography resins along with the elaboration of hardware (columns, chromatography setups) that yields sensitivity improvements have had their share in the way proteomics has evolved over the years;
Bioinformatics: The development and refinement of software that can cope with extremely large data sets (think metaproteomics) is one major field that enabled significant advances in proteomics. Also, refinement of algorithms related to the simulation of isotopic clusters and comparison with experimental data have had their part. Likewise so for algorithms that detect the charge of ions based on the analysis of the isotopic cluster peaks. Being able to single out without error the monoisotopic peak of an isotopic cluster (whater the ion charge or m/z ratio) is a big part of the successfully tackled challenges at the root of successful proteomics data processing.
In this section, we will review the bioinformatics-based mass spectrometric data processing, as it is the core subject of this user manual. In particular, we will provide an outline of how the major software packages on the market perform protein identification on the basis of mass spectrometric analyses of biological samples.
This section will outline in not-so-rough terms how bottom-up proteomics works, from the protein sample to the protein identification list. The workflow comprises two sequential processes:
From the protein to the sequences of the peptides: this initial part of the workflow is somehow doubled by having two parallel processes replicating it:
In silico process;
Experimental process.
These two processes are described in Figure 2.5, “Theoretical and experimental parallel data-producing processes”.
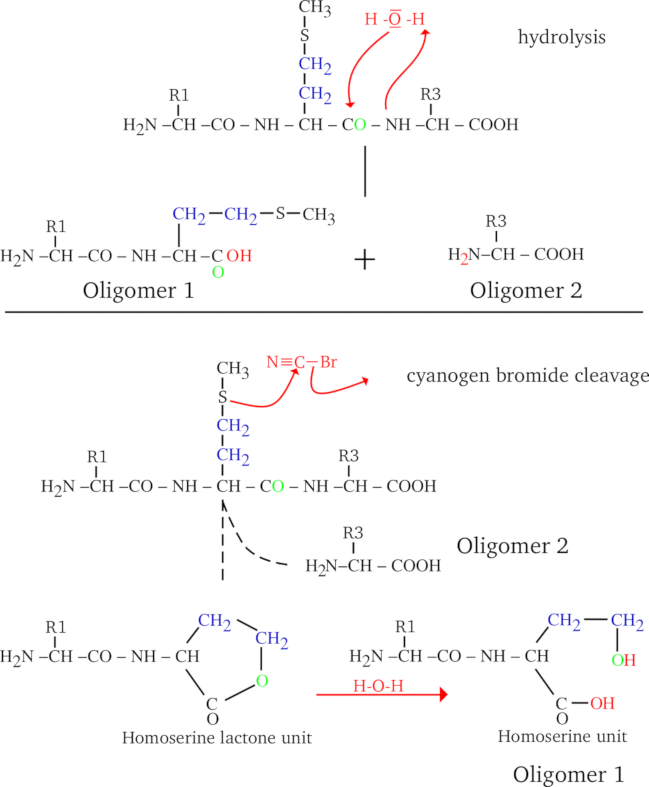
The digestion of the proteins, the analysis of the m/z of the peptides and the sequencing of the peptides are processes that exist both in silico and experimentally. This figure shows how the processes somehow mirror each other in the virtual and real contexts.
Figure 2.5: Theoretical and experimental parallel data-producing processes #
Database searching using experimental data: this last part of the workflow is entirely based on bioinformatics software and involves the search for peptide vs mass spectrum matches and then a process called protein inference (see Section 2.2.5, “Matching Fragmentation Spectra with Theoretical Spectra”).
2.2.1 The First Step: Digestion of the Sample's Proteins #
The very first step in the bottom-up protemics workflow is to digest all the proteins in the initial biological sample with a site-specific endoprotease: typically tryspin.
The sample is subjected to proteolysis with all its proteins unresolved. This produces a highly complex mixture of peptides, each having a constant characteristic: each peptide has one predictable end (unless it is either the protein's N-terminal or the C-terminal peptide, as detailed below), either N-terminal or C-terminal:
Predictable N-terminus: when the protease cuts at the N-terminal end of the target residue. For example, EndAspN cleaves left of Asp residues, thus producing peptides that always have Asp as their N-terminal residue. The only exception is when the peptide is the protein's N-terminal peptide and the first residue is not Asp);
Predictable C-terminus: when the protease cuts at the C-terminal end of the target residue. For example, the most used enzyme, trypsin, cuts right of the basic residues Lys and Arg. The generated peptides thus necessarily end with one of these two residues. The only exception is when the peptide is the protein's C-terminal peptide and the last residue is not Lys nor Arg.

Tip
One interesting feature of trypsinolyis is that it generates peptides that—for their major part—will most probably be protonated twice: on their N-terminal end (the primary NH2 amine group [4] and on the basic residual chain of the basic residue found at their C-terminal position (the ɛ-amine group for Lys and the guanidium group for Arg). Upon fragmentation of the peptide's precursor ion, both the left hand side fragment and the right hand side fragment will bear a proton and will thus be detected, thus potentially providing a better coverage of the peptide's sequence during the MS/MS experiment.
2.2.2 Chromatographic Separation of the Peptidic Mixture #
One major analytic step in bottom-up proteomics is the separation of the peptides obtained by endoproteolysis of all the proteins in the sample. Indeed, analyzing all the peptides in one single injection without any prior chromatographic separation would yield catastrophic results, similar to having injected nothing in the mass spectrometer.
The typical method for resolving peptides is by separating them on a chromatographic column functionalized with a hydrophobic group (for peptides, that would be a C18 reversed phase column).
The chromatographic gradient that will elute the peptides progressively according to their increasing hydrophobicity will be developed over the 5–95 % of acetonitrile (a non-protic organic solvent).
Tip
Using acetonitrile as the non-protic organic solvent has the huge benefit of not injecting protons inside the mass spectrometer as the chromatographic gradient develops.
The eluate of the chromatographic column is directly injected into the mass spectrometer's source. The role of the mass spectrometer's source device is to ensure that the analytes are desolvated and ionized upon their entering in the core part of the mass spectrometer. Most often, that source is an electrospray source that is fed a liquid (typically, the eluate from the column). The source is designed to evaporate the solvent (analyte desolvation) and—having an electric potential applied to it— to help ionize the analytes (often the peptides are already ionized in solution, prior to desolvation). The electrically charged analytes in the gas phase are thus ions, the m/z (mass-to-charge) ratio of which can be measured by the mass spectrometer analyzer.
Warning
There are two main sources used in the mass-spectrometry-for-biology specialty: the matrix-assisted laser desorption ionization (MALDI) source and the electrospray ionization (ESI) source. One important difference between the two is that the MALDI process mostly produces mono-charged ions ([M+H]+), while the ESI process mostly produces multi-charged ions ([M+nH]n+). This has huge implications in the mass data analysis.
The source that is mainly used in bottom-up proteomics is the ESI source.
2.2.3 Mass Spectrometric Analysis of the Peptides #
Upon elution off the chromatographic column, the peptides are desolvated, ionized and drawn into the mass spectrometer using an electrical field. Once they have entered the mass spectrometer they are analyzed in the mass analyzer of the instrument.
Note
There are a variety of mass analyzers commonly used in bottom-up proteomics. In fact, one single instrument might have as many as 4 or 5 mass analyzers. However, not all the analyzers in the instrument are responsible for the m/z measurement.
Sometimes, during the whole cycle of the analysis, two different mass analyzers are used at different steps of the cycle: one analyzer selects the ion for fragmentation and another analyzer measures the m/z value of the fragments.
In bottom-up proteomics, two different kinds of mass spectrometric data are required—ideally, for each peptide eluted from the column— in order to effectively identify the proteins in the initial sample:
The mass-to-charge ratio value (m/z) of the peptide ion;
The m/z values of the fragments (the product ions) of the peptidic precursor ion that has undergone an MS/MS gas phase fragmentation[5].
These two kinds of data are necessary because the protein identification process is based on searches in protein databases using the precursion ions' m/z value and the m/z values of that ion's fragments when it is fragmented. The way the protein databases are used as the substrate of these searches is described in the next section.
2.2.4 The Protein Databases and Their Use #
The previous section ended on the idea that the protein identification process, that is based on the analysis of all the peptides of a peptidic mixture resulting from the endoproteolysis of a sample containing many proteins, requires searches into protein databases.
A bottom-up proteomics experiment typically needs at least one protein database: a database listing all the known proteins of the organism from which the initial sample of proteins was prepared. That organism might be a bacterium, a Eucaryote, like a fungus, a protist, a plant, a mammalian… Optional databases might be used, like protein databases listing all known protein contaminants, for example.
The protein databases are files in the following FASTA format:
      >GRMZM2G009506_P01 NP_001149383 serine/threonine-protein kinase receptor
      MEEQHMAGPPYRYRLQHRRLMDIAPASASDDDSGHHGSNGMAIMVSILVVVIVCTLFYCV
      YCWRWRKRNAVRRAQIERLRPMSSSDLPLMDLSSIHEATNSFSKENKLGEGGFGPVYRGV
      MGGGAEIAVKRLSARSRQGAAEFRNEVELIAKLQHRNLVRLLGCCVERDEKMLVYEYLPN
      RSLDSFLFDSRKSGQLDWKTRQSIVLGIARGMLYLHEDSCLKVIHRDLKASNVLLDNRMN
      PKISDFGMAKIFEEEGNEPNTGPVVGTYGYMAPEYAMEGVFSVKSDVFSFGVLVLEILSG
      QRNGSMYLQEHQHTLIQDAWKLWNEDRAAEFMDAALAGSYPRDEAWRCFHVGLLCVQESP
      DLRPTMSSVVLMLISDQTAQQMPAPAQPPLFASSRLGRKASASDLSLAMKTETTKTQSVN
      EVSISMMEPRFWADPGTSNGAATSHPATGACKKRGGQGGDRNVKDGLAARTPTHQPVARW
      HHDRRIVD
This format is really simple, because it only contains three information pieces, grouped in as many stanzas as there are proteins in the database:
The unique protein's accession id in the database (
GRMZM2G009506_P01) that comes right after the '>' prompt that signals a new protein stanza;The protein description (
NP_001149383
          serine/threonine-protein kinase receptor
) that provides some functional data bits for the protein at hand;The protein sequence (the rest of the stanza above).
The first (id) and second (description) information bits are used in various places in the i2MassChroQ program.
The protein databases are used by the protein identification software as the very first step in a bottom-up proteomics data analysis process: the proteins in the database are digested in silico in order to produce a list of peptides that retain a connection to the protein from which they were generated. For each one of all these peptides, the following data bits are computed (Figure 2.5, “Theoretical and experimental parallel data-producing processes”, top panel):
sequence: The peptide's sequence;
m/z value: The peptide's m/z value, often computed for the mono-protonated ([M+H]+) ion;
MS/MS spectrum: The peptide's fragmentation spectrum is nothing but an array of m/z values corresponding to the set of calculated fragments (of the b and y ion series). The m/z values of the product ions are crucial for the database search algorithm;
The next step is the establishment of a relation between the experimental MS/MS data acquired by the instrument and the theoretical MS/MS spectra computed from the protein sequences in the database. This next step is described in detail in the next sections.
2.2.5 Matching Fragmentation Spectra with Theoretical Spectra #
This section is about how the protein database searching software sets a relation between the experimental mass data and the theoretical mass data originating in the protein database. The elementary relation is between a given experimental MS/MS mass spectrum of a peptide's ion at a given m/z value and its theoretical counterpart from the database: when these two MS/MS spectra match at a sufficiently convincing level, then a “peptide vs mass spectrum match” was achieved (abbreviated name: PSM). The computing of a PSM is described in detail in Figure 2.6, “The steps leading to a scored peptide vs mass spectrum match (PSM)”.
We have seen in Section 2.2.4, “The Protein Databases and Their Use”, that two somehow similar processes are at the basis of the preparation of the data for the subsequent database searches. These processes were described in Figure 2.5, “Theoretical and experimental parallel data-producing processes”.
On the one hand (top panel, violet), the protein database is processed to digest in silico every protein it contains into a list of peptides. For each peptide arising from the digestion of a protein, the following data elements are recorded:
The peptide's m/z value is computed. The association between that m/z value, the peptide and its originating protein is maintained;
The peptide is fragmented into a list of peptidic fragments (product ions' m/z values, that is, the MS/MS spectrum; typically b and y ions series). The connection with the earlier data elements above is also maintainted.
It is thus easy to determine the filiation between any given MS/MS theoretical mass spectrum, the precursor ion's m/z value, the peptidic sequence and, finally, the protein whence that peptide came.
On the other hand (bottom panel, green), the mass spectrometric data acquisition yields a huge set of the following pairs of data elements that are recorded over time:
The m/z value of the peptidic precursor ion undergoing fragmentation (keeping a connection with the retention time at which it is recorded);
The list of peptidic fragments (product ions' m/z values, that is, the MS/MS spectrum). The connection with the precursor ions' m/z value and with the retention time is maintained.
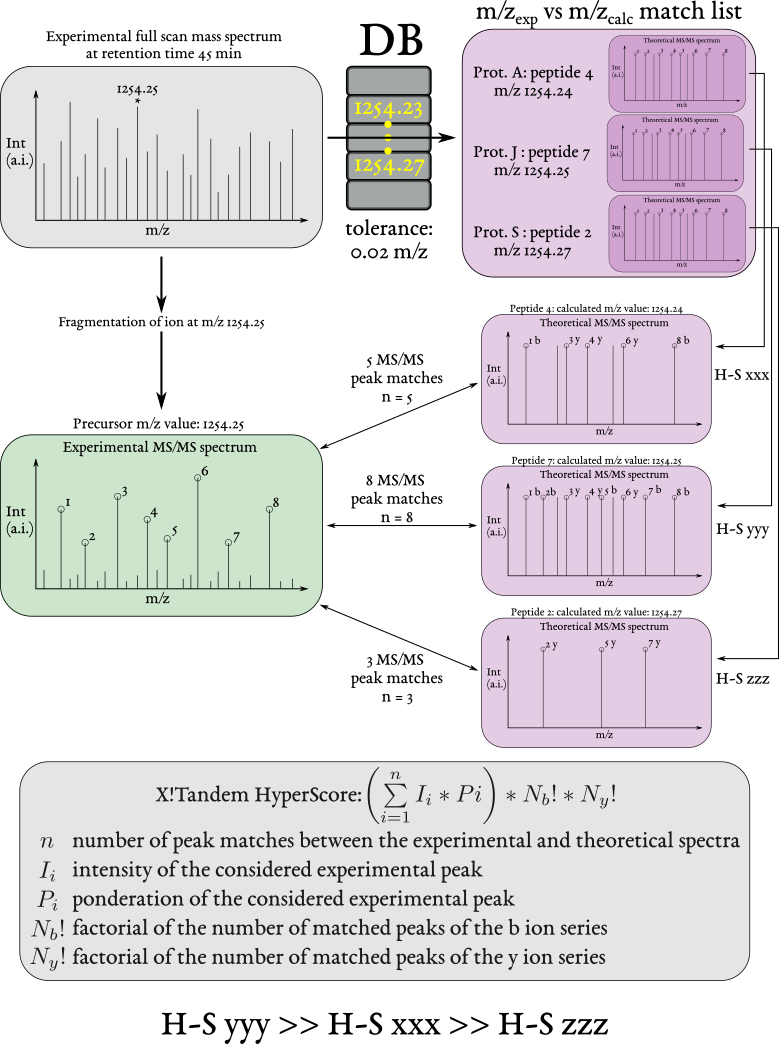
The process starts with a full scan mass spectrum from which the mass spectrometer selects one precursor ion at a definite m/z value. That ion is fragmented and thus generates a MS/MS spectrum. During the data exploration, the software extracts from the database all the peptides having the same m/z value as that of the fragmented ion (top right, violet background). Next, the experimental MS/MS spectrum is compared in turn to each one of the MS/MS spectra of the extracted peptide list. A HyperScore is computed at each comparison. Because i2MassChroQ uses X!Tandem as its preferred protein database search engine, the HyperScore calculation, as performed by X!Tandem, is described.
Figure 2.6: The steps leading to a scored peptide vs mass spectrum match (PSM) #
Once the acquisition of the experimental data is complete, the analysis of these data involves going through all the fragmentation data of the acquisition and performing these steps for each MS/MS spectrum (as evidenced in Figure 2.6, “The steps leading to a scored peptide vs mass spectrum match (PSM)”:
Get the precursor ion's m/z value;
Compute the match m/z range. For example, if the software is configured with a m/z tolerance for the m/z matches set to 0.02 and the precursor ion's m/z value is 1254.25, then the match m/z range would be [1254.23–1254.27];
Construct a list of all the peptides in the database that have their m/z value contained in the match m/z range;
For each peptide in the list returned from the database, compare its theoretical MS/MS spectrum with the experimental one. Compute a HyperScore for comparison.
2.2.5.1 Computation of the PSM HyperScore #
Of course, it is extremely rare that an experimental MS/MS spectrum matches fragment-by-fragment an identical theoretical spectrum. Most often, some theoretical product ions (MS/MS spectrum peaks) are missing from the experimental fragmentation spectrum. Also, there will almost certainly be dozens (if not hundreds) of peptides having a m/z value in the searched m/z range. Most certainly, the vast majority of these peptides are not of the right sequence (that is, do not have their MS/MS theoretical mass spectrum matching the experimental one). To make without any human scrutiny of the matches, it is necessary to compute a score that somehow assesses the extent to which both the experimental and theoretical MS/MS spectra match. That score, in X!Tandem, is called HyperScore and is described at the bottom of the figure.
The HyperScore computation process is relatively straightforward. First off, it is necessary to stress the fact that a HyperScore is computed each time an experimental MS/MS spectrum is compared to a theoretical (calculated) MS/MS spectrum (see m/zexp vs m/zcalc match list in Figure 2.6, “The steps leading to a scored peptide vs mass spectrum match (PSM)”).
In the example, three peptides from the database have their m/z value matching the searched m/z range (the m/z value of the precursor ion with accounting for the tolerance). So, the program checks the similarity between the experimental MS/MS spectrum and each one of the three theoretical ones. Each similarity test is associated to a HyperScore value.
The HyperScore is computed by summing—for each tested fragment peak in the theoretical MS/MS spectrum—the product of two variables described below. Once that sum is computed, it is compounded by two factorial numbers also described below:
Ii: the intensity of the matching mass peak in the experimental MS/MS spectrum (if found);
Pi: the ponderation factor of the matching mass peak in the experimental MS/MS spectrum. That variable can take a number of values, depending on the presence or not of this fragment peak in the experimental MS/MS spectrum (if not found, then Pi is naught and the peak is disregarded entirely). There are other values greater than naught, accounting for the physico-chemical properties of the peptidic bond that was cleaved to obtain that fragment (presence of proline will lower the P value, for example).
Intuitively, the HyperScore will end up larger if there are a lot of fragment peaks in the theoretical MS/MS spectrum that are matched with experimental ones (each Pi value compounded by the Ii value is being summed into the HyperScore final value).
Nb!: the sum computed above is then compounded by the factorial of the number of ions of the b ion series that are found in the experimental MS/MS spectrum;
Ny!: the product computed at the previous step is then compounded by factorial of the number of ions of the y ion series that are found in the experimental MS/MS spectrum.
This last compounding operation terminates the computation of the HyperScore value.
It is apparent now that the HyperScore value will tend to be greater if there are numerous fragment peaks in the theoretical MS/MS spectrum that are matched by fragment peaks in the experimental MS/MS spectrum. Also, the score value is incremented if the intensity of the matching peaks is greater and if the number of matching peaks of the two b and y ions series is greater.
This, however, cannot be all of it, because the HyperScore does not really answers the question: “what are—if any—, of all the PSMs found for a given experimental MS/MS spectrum, the one (or ones) that we can faithfully tell as true match(es)?”. To answer that question, some more computational steps need to be carried over, that should lead to a numerical value that is truly indicative of the confidence we may have that a given PSM is a real match. In X!Tandem, that numerical value is called expectation value (abbreviation: E-value). We describe the whole process of its computation below.
2.2.5.2 Computation of the Peptide Expectation Value (E-value) #
First of all, it needs stating that we describe the peptide E-value, not the protein E-value. A peptide E-value is obtained for a single experimental MS/MS spectrum. It is computed by looking into the HyperScore values obtained for all the MS/MS spectra comparisons described at the previous section. The HyperScore values (for example, the three values denoted H-S xxx, H-S yyy and H-S zzz in Figure 2.6, “The steps leading to a scored peptide vs mass spectrum match (PSM)”) are used to perform the E-value computation. In the following text, we'll assume that there are many more PSMs than these three, for a given experimental MS/MS spectrum (which is actually the reality, with hundreds of peptides in the database that match a given searched m/z range). As illustrated in Figure 2.7, “Computation of a peptidic expectation value (E-value)”, a histogram is crafted plotting the count of MS/MS spectral pair comparisons (let us call them “wannabe PSMs”) against a number of HyperScore bins. This histogram is a good representation of the distribution of the HyperScore values among the various peptides in the m/z value-matching list (see previous section). In this example, the very best HyperScore value is 82 and the number of PSMs having that score is obviously very low! Instead, the distribution clearly shows that there are a vast majority of wannabe PSMs that have very low HyperScore values and that will not ultimately be considered as real PSMs.
In order to be able to use the distribution pattern further, the second half of the distribution's main peak is replotted by computing the natural logarithm of the count of MS/MS spectral pair comparisons, still against the HyperScore value bins. The new plot is easily fitted into a line, of which the equation is computed.
The best HyperScore value (82, in the example) is then used in the line equation to compute the corresponding ordinate (the natural logarithm of the PSMs count having that HyperScore). That value (-8.4, in the example) corresponds to the natural logarithm of the expectation value (E-value). By using the exponential function, the E-value is thus computed to be 0.00022, which a pretty low number. Since the E-value somehow gives an idea that a given PSM was obtained by chance, the very small obtained result shows that the match almost certainly was a faithful one.
Note
The expectation value is defined as the probability that the peptide sequence would match an experimental tandem mass spectrum by chance, if the trial is repeated many times. For example, if the E-value is found to be 1, then that means that the match can occur by chance or not with an equal probability. Instead, if the E-value is found to be 0.01, then that means that there is one event over 100 trials that the match has occurred by chance.
The smaller the E-value, the more confidence one has that the match is correct and that the PSM is a faithful one.
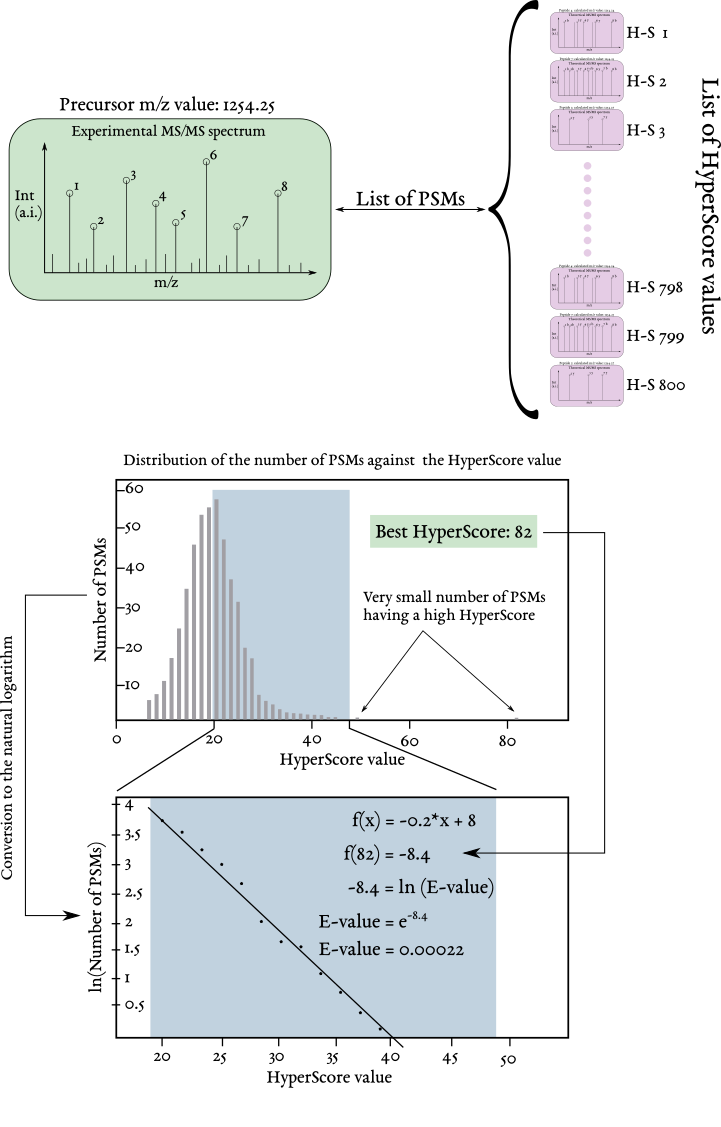
For each experimental MS/MS spectrum, gather all the peptides in the database that have a m/z value matching the precursor ion's m/z value. For each peptide sequence, compute the HyperScore. With all the HyperScore values, go on with the calculation of the expectation value for the peptide set. The peptidic E-value should be the smallest possible, as it is an indication of the possibility that the match between the experimental MS/MS spectrum and the theoretical mass spectrum occurred by chance.
Figure 2.7: Computation of a peptidic expectation value (E-value) #
Tip
The user configures the software to only consider PSMs if their peptidic E-value is below a given threshold. Typically, that threshold is given a value of 0.05 (Figure 3.6, “Configuration of the loading of the identification results”).
When a reliable match between an experimental MS/MS spectrum and a theoretical MS/MS spectrum is found (that is, a true PSM), the software reports the following set of data elements:
m/z: the m/z value of the precursor peptidic ion that underwent fragmentation;
sequence: the sequence of the peptide that was matched in the present PSM;
protein name: the protein accession number that produced the matched peptide upon enzymatic digestion of the sample;
E-value: the peptide expectation value, as described above.
2.2.5.3 Computation of the Protein Expectation Value (E-value) #
The last step in the computation of values that help the software and the user determine if identifications are faithful (for peptides and for proteins) is the computation of the protein expected value. This value is very easily computed: it is the product of the E-values of all the peptides that participated in the identification of the protein.
By necessity, then, the protein E-value will be less than the threshold peptide E-value (since that last value is below 1). By default, the protein E-value is set to 0.01 (Figure 3.6, “Configuration of the loading of the identification results”).
2.2.5.4 Protein Inference: from PSMs to Protein Identities #
One remaining critical question is: “— How is the list of protein identifications returned by the database searching software verified and modified?” Indeed, there are a number of situation where the proteomics data user may want to tweak the identification results. But also, the protein identification list returned by the database software may not be as perfect as one would expect. Bioinformaticians working in proteomics have come up with a number of algorithms to better the reliability of the identification results returned by database searching software.
In i2MassChroQ we use an algorithm that is impinged on the concept of parcimony. That algorithm is detailed in an article describing X!TandemPipeline-Java that was published in The Journal of Proteome Research in 2017 by Olivier Langella and Colleagues. The general concepts are presented here for the sake of completeness of this user manual.
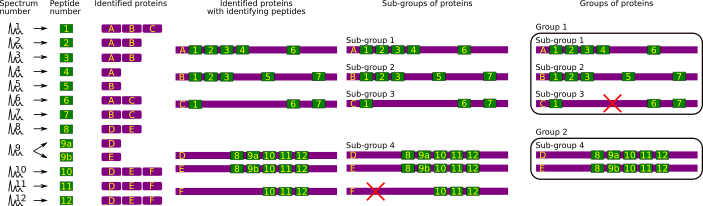
The process of establishing a consolidated protein identity list from the results reported by the database searching software is illustrated (see text).
Figure 2.8: Protein inference: constructing a consolidated protein identifications list #
The protein inference process, depicted in Figure 2.8, “Protein inference: constructing a consolidated protein identifications list”, is a multi-step one. The starting point is the huge list of PSMs that are reported by the database searching software. These PSMs are displayed in the figure as the two columns on the left hand side: one experimental MS/MS spectrum (Spectrum number) has provided a convincing PSM and thus allowed the identification of a peptide (MS/MS 1 → Pep 1, Peptide number). Of course, a given peptide (Pep 1) might have allowed the identification of multiple proteins (for example, homologous proteins that share the same peptidic sequence). Thus, Pep 1 is found in proteins A, B and C (column Identified proteins). The structure of the identified proteins can thus be partially reconstructed, and that is shown in column Identified proteins with identifying peptides. All the other PSMs are listed below that first one.
The general concept of the algorithm is that, by going through all the PSM data it is possible to check if some form of degraded redundancy allows pruning off some proteins from the list. This pruning off of some proteins is meant to increase the confidence that the identifications are reliable. That might be at the cost of having a smaller number of identified proteins, but with an improved false discovery rate (that is, a reduced FDR). As described below, the pruning off of proteins from the protien identifications list occurs at two different steps in the inference process.
Note
The FDR is commonly computed as the ratio between the number of PSMs matching the decoy database over the number of PSMs matching the target database: FDR = (#decoy / #target).
The first step is the creation of sub-groups of the identified proteins. In this step, all the proteins that could be identified thanks to the exactly same set of peptides are gathered into a sub-group. In the example, the sub-group that contains more than one protein happens to be sub-group 4. Note how protein F in this sub-group is identified by a set of three peptides. This is two peptides less than the number of peptides that identified the other two proteins (D and E) in the sub-group. The principle of parcimony allows thus to remove Protein F as that protein is not justified per se, that is, it is unnecessary to explain the presence of the three peptides.
The second step is the creation of groups that gather all the sub-groups that share at least one peptide. Thus, group 1 contains sub-groups 1, 2 and 3, while group 2 contains the sub-group 4. According to exactly the same philosophy as for the previous step, the sub-groups that contain proteins identified only by peptides also shared by proteins present in other sub-groups are pruned off.
The whole process described here is dubbed “protein grouping” in the i2MassChroQ language. The ouptput of this protein grouping process is displayed in the protein identification window, to be described below.
2.2.6 Phospho-Proteomics #
In this section, the typical procedures involved in phospho-proteomics projects are described, from the sample handling to the post-translational modification data exploration.
2.2.6.1 Handling Phospho-Proteomics Samples #
i2MassChroQ is able to cope with phospho-peptides. The mass spectrometric data are acquired exactly as usual with the mass spectrometer, but the sample preparation goes along theses steps:
Separate digestion of the samples (when there are more than one);
Labeling of the peptides, each sample gets a different label;
Pool of the whole set of peptides into a single mixture;
Separation of the peptides on a strong cation exchange (SCX) resin, collection of the fractions;
Phospho-peptide enrichment using IMAC[6] for each SCX fraction. The SCX fraction is loaded onto the IMAC resin and, following a wash step, the phospho-peptides are eluted (pH-based elution). There is thus a one-to-one relation between a SCX fraction and an IMAC-based purification fraction.
Mass spectrometric analysis of each IMAC-based phospho-peptide-enriched fraction.
X!Tandem needs to be configured in such a manner that it can generate all the theoretical peptides (and fragments) that might bear the phosphoryl group. This process is described in the section below.
2.2.6.2 Protein Identification in Phospho-Proteomics Projects #
An analogous algorithm as the one used for protein inference is at play when i2MassChroQ is handling phospho-proteomics data. That algorithm is described below and in Figure 2.9, “Phospho-site inference: constructing a consolidated phospho-site list”.
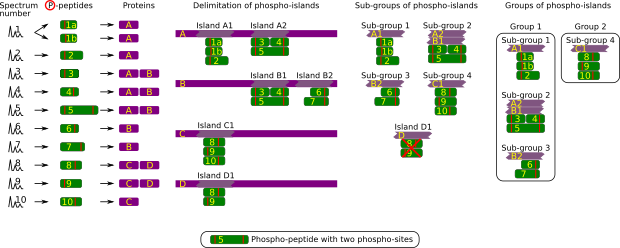
The process of establishing a consolidated phospho-site list from the results reported by the database searching software is illustrated (see text).
Figure 2.9: Phospho-site inference: constructing a consolidated phospho-site list #
The phospho-island inference process, depicted in Figure 2.9, “Phospho-site inference: constructing a consolidated phospho-site list”, is a multi-step one, most similarly to what was described in Section 2.2.5.4, “Protein Inference: from PSMs to Protein Identities”. The starting point is the list of peptides that were identified and determined to bear one or more phospho-sites (thus called phospho-peptides; see the red vertical bar in the figure). Two difficulties here are, on the one hand, the fact that phospho-sites may be shared by more than one peptide and, on the other hand, the fact that more than one phospho-site might be determined on the same peptide. These are the reasons that the concept of phospho-island was elaborated: it is a protein region that bears at least one phospho-site, in turn beared by one or several overlapping phospho-peptides. It is important to note that the position and number of phospho-sites are not necessarily the same in all of the overlapping phospho-peptides.
In this inference process, the analogy with the previously described one is the following:
Peptides are replaced by phospho-peptides;
Proteins are replaced by phospho-islands.
In the first step, the phospho-islands are delimited on the phosphorylated proteins. In the second step, sub-groups of phospho-islands are created using all the phospho-islands identified in different proteins and that share exactly the same set of phospho-peptides. At this step, any remaining phospho-island defined by a subset of phospho-peptides only partially defining a sub-group is disregarded. In the example, phospho-island D1 is defined by two phospho-petides, 8 and 9, that also are part of a sub-group defined by these two peptides but also by phospho-peptide 10. Phospho-island D1 is thus disregarded.
In the third step, all the sub-groups that contain phospho-islands beared by the same protein are gathered in a group.
[4] If not either converted to an amide group by acetylation or formylation or cyclised.
[5] Most often, that fragmentation step is performed using collisionally-activated dissociation (CID). In this process, the peptidic precursor ion is first isolated in the gas phase on the basis of its m/z value and then is accelerated against a gas “fog” inside of the collision cell of the instrument. The ion hits gas molecules multiple times, acquires a lot of energy and finally breaks.
[6] Immobilized-metal affinity chromatography.