i2MassChroQ User Manual
- Preface
- 1 Generalities
- 2 Fundamentals in Bottom-up Proteomics
- 3 The main program window
- 4 Exploring identification data
- 5 Exploring post-translational modification data
- 6 Advanced Proteomics Configurations
- 7 i2MassChroQ and Quantitative Proteomics
- 8 Specific procedures for the timsTOF line of instruments
- A GNU General Public License version 3
5 Exploring post-translational modification data
This chapter describes in detail all the steps that the user accomplishes in their post-translational modification (PTM) data exploration session.
5.1 Setting the X!Tandem Run Presets for Phospho-proteomics #
The very first step in starting a phospho-proteomics-based protein identification run is to configure the run so that the database search engine can model phopshorylated peptides on the basis of the sequence of the peptides in the database. That configuration step is started as described in Figure 5.1, “X!Tandem settings window for a phospho-proteomics project”.
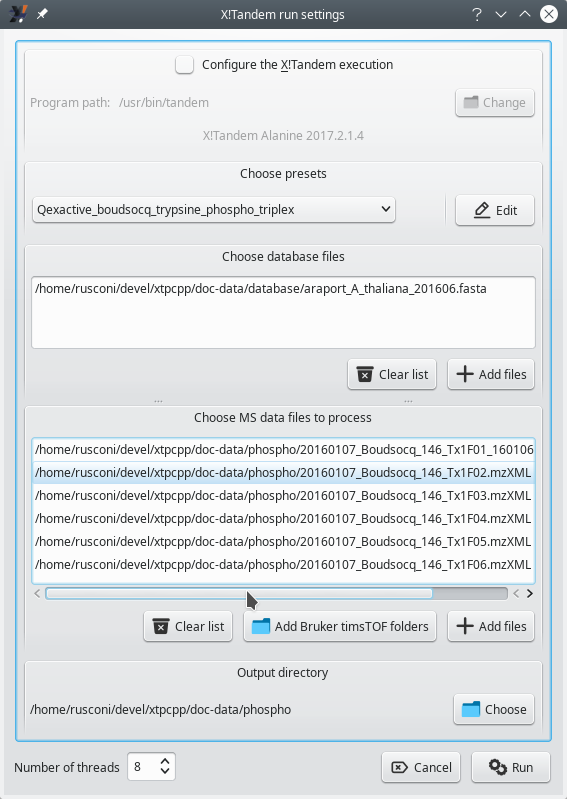
The Choose presets option in this window allows the user to select an X!Tandem presets file to suit the protein identification run. In this example, the chosen presets file contains a number of configuration bits specific for a phospho-proteomics project.
Figure 5.1: X!Tandem settings window for a phospho-proteomics project #
The configuration of X!Tandem needs to be performed by using the presets method, described in Section 3.3, “Setting the X!Tandem Run Presets” and following sections. The Edit button next to the drop down list allows one to edit the presets that configure the handling of the database by the X!Tandem database search engine. The window that opens up upon clicking onto that button has two tabs that require the user's attention, as shown in Figure 5.2, “Setting the project to be a phospho-proteomics project” and Figure 5.3, “Configuring the phosphorylated residues”.
As described in Section 3.3.1, “Loading existing presets configurations from file”, it is possible to load existing presets in case these were defined already and might be reused for a repeated data exploration session on the same data set.
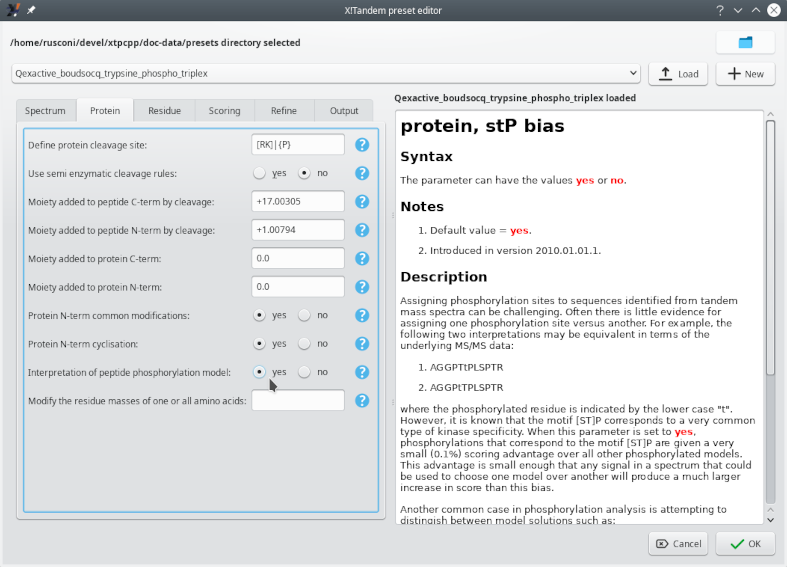
The major bit that need the user's attention in the Preset editor window's Protein tab is the Interpretation of peptide phosphorylation model to yes. The question mark icon on the side of that configuration option displays explanatory text on the right hand side of the window.
Figure 5.2: Setting the project to be a phospho-proteomics project #
The phosphorylation events are not Fixed modifications because it is not possible to predict that they will occur systematically. This is the reason why the phosphorylation events are configured as Potential modifications.
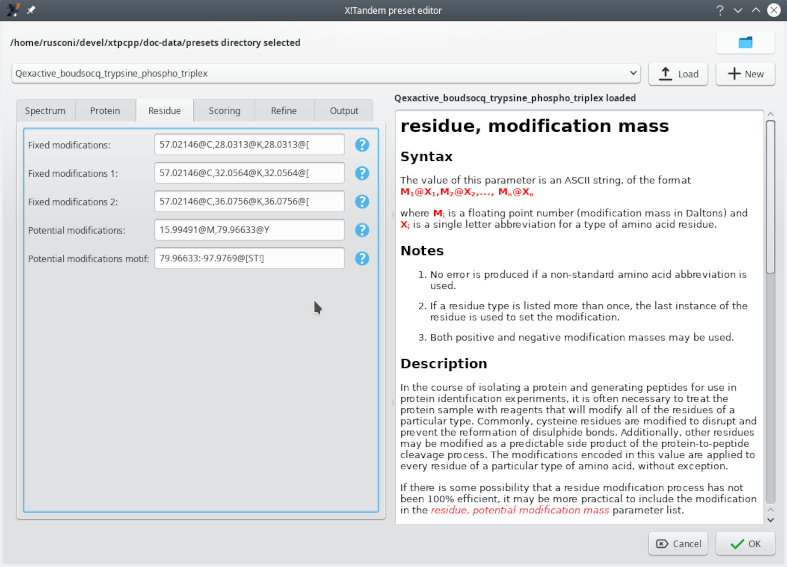
Figure 5.3: Configuring the phosphorylated residues #
Figure 5.3, “Configuring the phosphorylated residues” shows how to configure the potential phosphorylation of selected residues (tyrosine, threonine and serine). Setting the X!Tandem parameters for phosphoproteomics analyses involves specifying the mass difference between unmodified and modified residues and the nature of the residue that might bear the modification. There are two different settings available:
Potential modifications: the Y residue might be phosphorylated, with a net mass increment of 79.96633 Da.
Potential modifications motif: the S and T residues might be phosphorylated (net mass increment of 79.96633 Da) or be subject to a neutral phosphoric acid loss (net mass loss of 97.9769 Da).
The reason why the potential phosphorylation of tyrosine (Y) is not mentioned along with the S and T modifications in the motif setting is that phosphorylated tyrosine residues do not suffer from phosphoric acid neutral loss upon collisionally activated dissociation (CID). Phosphorylated serine and threonine residues are readily dephosphorylated upon CID. Hence, the requirement to configure both the phosphorylation and the dephosphorylation events as a PROSITE motif (see the question mark help).
Tip
The loss of a phosphoric acid molecule (not ion) is called a “neutral loss”. By essence, the lost molecule cannot be detected, because it bears no charge. However, the search software may detect that there might be a negative mass delta between calculated fragments bearing a phoshoryl group and the measured mass of product ions. In this eventuality, the software may deduce that the fragment was phosphorylated before the fragmentation occurred.
The mass spectrometer might be configured to monitor neutral phosphoric acid loss, or not. In some instruments, that workflow is not available; however, in these instruments a higher energy collisional dissociation[10] process elicits two fragmentation events: loss of a phosphoric acid molecule and peptide backbone dissociation. In this case, the database searching engine (X!Tandem, for us) is instructed to monitor the loss of phosphoric acid (that is, a neutral loss) on the product ions of the y ion series. In the best cases (best sequence coverage by the product ions), it is thus possible to locate the phosphoryl group on the peptide.
Caution: Phospho-proteomics projects often involve label-based quantification
The Residue tab of the X!Tandem preset editor window shown above lists a number of fixed modifications that need an explanation, because we'll find them later in other figures. The 57.02146@C modification is the carbamidomethylation of cysteine residues. The various 28, 32 and 36 mass increments on lysine residues are the di-methylation modifications with (32, 36) or without (28) heavy isotopes[11]. The exact same mass increments labelled with the “@[” notation are the same modifications occurring on the N-terminus of the peptide.
Once all the settings have been validated, click the Run button, in the same manner as described at Section 3.3.4, “Running a properly configured X!Tandem process”, to actually start the database search process.
5.2 Loading the Protein Identification Results #
The loading of the protein identification results for a phospho-proteomics project occurs in an identical fashion as for a non phospho-proteomics project, as described in Section 3.4, “Loading the Protein Identification Results”. The main program window shows the same Identifications tab as described before (see Figure 5.4, “The main window's Identifications tab”).
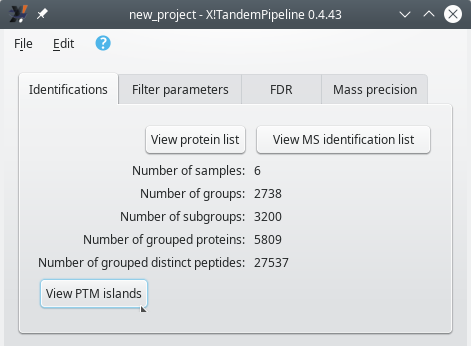
The Identifications tab inside of the main program window after loading a PTMs-based project's identification results files. The View protein list and View MS identification list buttons perform exactly as described earlier. In order to trigger the PTMs-based data exploration session, click the View PTM islands button.
Figure 5.4: The main window's Identifications tab #
When i2MassChroQ has done loading all the results, the Protein list window opens up as it usually does. This window, however, is not devoted to the exploration of phosho-proteomics data. In order to start the exploration of phospho-proteomics data, it is necessary to display a window that lists all the post-translational modification islands (“PTM islands”). That window shows up when the user clicks onto the View PTM islands button shown in Figure 5.4, “The main window's Identifications tab”.
5.3 Exploring PTM Islands Identification Data #
The workflow involved in the scrutiny of phospho-proteomics data is comparable to that for a conventional proteomis project, as described in Section 4.1, “The Protein List Window”. There are differences, however, both in terminology and in the kind of data presented to the user that require a detailed review, performed in the following sections. The first step is to show the PTM islands, which is the step analogous to showing the identified proteins. The second step is to look into a given PTM island by scrutinizing the PTM peptides that make it; this step is analogous to showing the peptide list for a given protein.
5.3.1 The PTM Islands List Window #
The PTM island list window in Figure 5.5, “PTM islands list window” displays, in a table view, all the PTM islands that were identified (see Section 2.2.6.2, “Protein Identification in Phospho-Proteomics Projects”). [12]
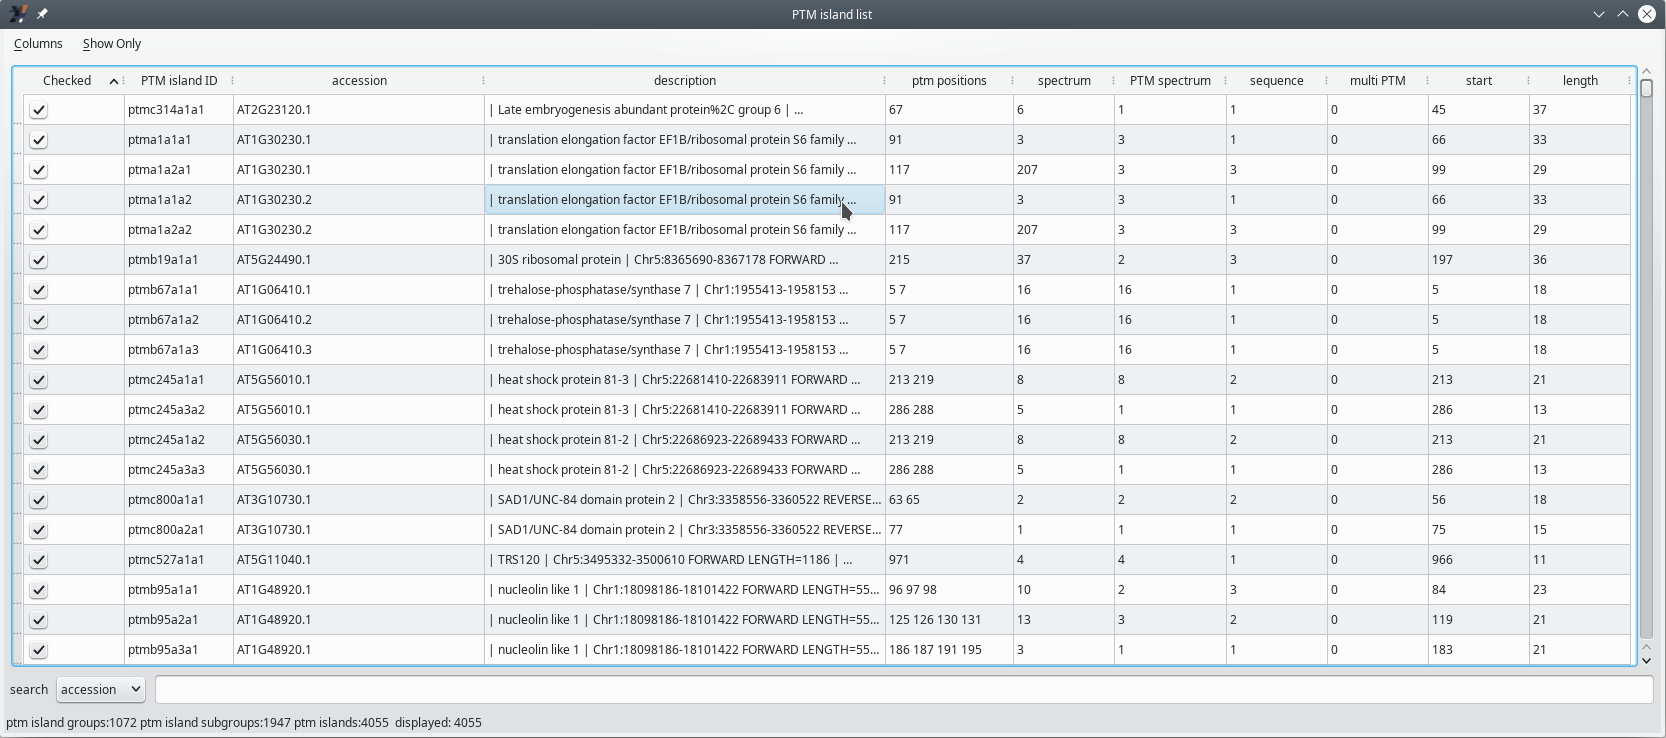
The PTM island list table view has many columns that characterize each PTM island, as described in detail in the text below.
Figure 5.5: PTM islands list window #
In the table view of all the PTM islands, each row corresponds to an island. It must be noted that multiple rows may appear as identical islands. This is not exactly true because, while the PTM islands appear to be exactly the same, these have been identified in proteins that are listed in the proteins database under different accession numbers (see the accession column of the table view).
The columns in the table view hold post-translational modification-specific data described below.
Checked: if checked, the corresponding PTM island will be taken into account;
PTM island ID: unambiguous identifier for the PTM island. The nomenclature is important and follows a precise syntax according to this scheme:
ptm<letter1><number><letter2><number><letter3><number>, with the following meaning:
<letter1><number>: identifies the group of proteins that share PTM islands;
<letter2><number>: identifies the PTM island in the above group;
<letter3><number>: identifies the accession number of the protein in the group above.
accession: the accession number of the protein in the protein database file;
description: the description of the protein in the protein database file;
ptm positions: the number of positions in the PTM island that bear a post-translational modification;
spectrum: number of distinct spectra that allowed defining this PTM island;
PTM spectrum: number of distinct spectra that allowed the identification of more than one searched post-translational modifications;
sequence: number of unique peptide sequences found in this PTM island;
multi PTM: number of spectra that allowed the identification of more than one post-translational modification site;
start: the position of the PTM island on the protein sequence (the first residue of the PTM island);
length: the number of residues that encompass the PTM island.
In the same way as for the Protein list window's table view of the identified proteins, the cells of the table are “active”: clicking onto any cell triggers the opening of a window that provides details about the corresponding PTM island.
5.3.2 Delving Inside the PTM Island Identification Data #
The protein identifications list table view, as pictured in Figure 5.5, “PTM islands list window” is actually an active matrix where the user can easily trigger the exposition of the data that yielded any PTM island identification element of the table. This is simply done by clicking onto any cell of the table at the row matching the PTM island for which scrutiny of the data is requested.
Depending on the column at which the mouse click happens, there might be two different windows showing up:
Clicking onto a cell in either the accession or description column opens the Protein details window shown in Figure 5.6, “Protein details window”.

This window provides details about the protein identified as bearing one or more post-translation modification(s). The peptides that were matched as PSMs are highlighted in yellow. The AT3G56150 provides a link to an external resource[13]. The other informational data bits are self-explanatory.
Figure 5.6: Protein details window #
Clicking onto a cell in the PTM island ID column opens the PTM peptide list window for that specific island. That window is displayed in both figures Figure 5.7, “PTM peptides list window (first columns)” and Figure 5.8, “PTM peptides list window (last columns)” in the following section (Section 5.4, “The PTM Peptides List Window”).
5.4 The PTM Peptides List Window #
Each PTM island is essentially defined by a set of related peptides that sport one or more post-translational modifications. The exploration of the PTM peptides thus involves looking into the different peptides of a PTM island. A number of characteristics of these peptides are described in the following text.
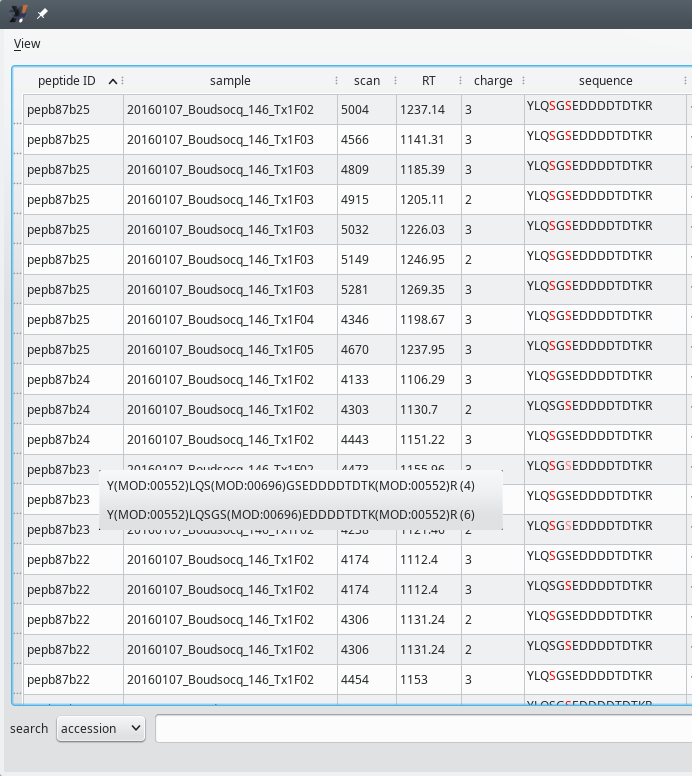
Every PTM island has, associated to it, a list of post-translationally modified peptides. This figure illustrates the first columns of the table view that lists all the peptides making a PTM island. The contextual menu visible near peptide ID pepb87b23 will be detailed later (Section 5.4.1.2, “Ambiguities on the post-translational modification sites”).
Figure 5.7: PTM peptides list window (first columns) #
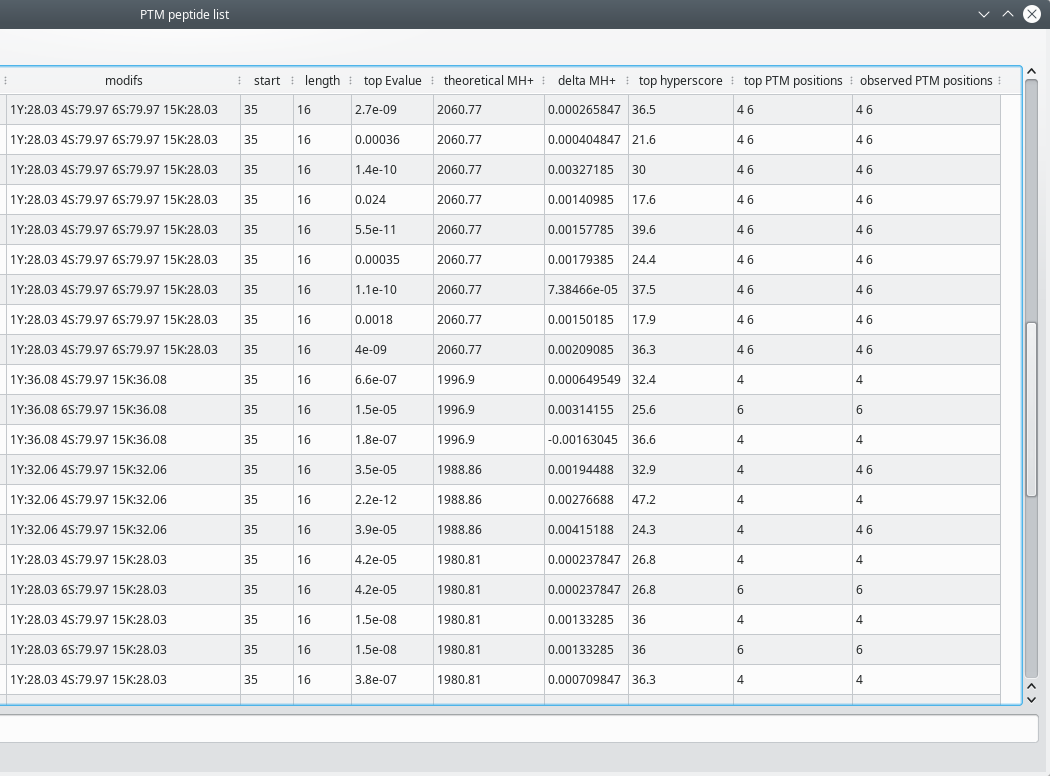
Every PTM island has, associated to it, a list of post-translationally modified peptides. This figure illustrates the last columns of the table view that lists all the peptides making a PTM island.
Figure 5.8: PTM peptides list window (last columns) #
The PTM peptide list window contains a large set of peptide characteristics organized in a number of columns, as described below:
peptide ID: the unambiguous identity of the peptide;
sample: the file name of the sample in which the peptide was found and sequenced;
scan: the scan number of the MS/MS spectrum in which the precursor peptidic ion was fragmented;
RT: the retention time at which the peptide eluted;
charge: the charge of the peptidic ion;
sequence: the sequence of the peptide. Note that the residues that do (or might) bear a post-translational modification are printed in red color;
modifs: a semi-column-separated list of modified positions. The modification is identified by the net mass change that occurs upon the chemical modification. The 1Y:32.06 4S:79.97 15K:32.06 example indicates that the tyrosine at position 1 is dimethylated, the serine at position 4 is phosphorylated and that the lysine at position 15 is methylated (the dimethyl modification was commented above).
start: the position of the peptide's first residue in the protein sequence;
length: the number of residues in the peptide;
top Evalue: best Evalue from those calculated for different peptide spectrum matches that occurred in a single fragmentation scan (see Section 5.4.1.2, “Ambiguities on the post-translational modification sites” below for a thorough description of this situation);
theoretical MH+: the calculated mass of the [M+H]+ peptidic ion;
delta MH+: the difference between the measured and the calculated [M+H]+ masses;
top hyperscore: best Hyperscore from those calculated for different peptide spectrum matches that occurred in a single fragmentation scan (see Section 5.4.1.2, “Ambiguities on the post-translational modification sites” below for a thorough description of this situation);
top PTM positions: positions of modified residues for the peptide having the best Evalue (see above) for the current scan;
observed PTM positions: space-separated list of all the modified positions found for the current scan.
5.4.1 Delving Inside the PTM Peptide Identification Data #
The PTM peptide list table view (Figure 5.7, “PTM peptides list window (first columns)”) is actually an active matrix where the user can easily trigger the exposition o fthe data that yielded any PTM peptide identification element of the table. This is simply done by clicking onto any cell of the table at the row matching the peptide for which scrutiny of the data is requested.
5.4.1.1 The Peptide Details Window #
Clicking a cell in the peptide ID column opens the Peptide details window shown in Figure 5.9, “Peptide details window”. Notice how this window is similar to the one described for conventional non PTM-based projects at Section 4.2.3.1, “The Peptide Details Window”.
This window displays a large amount of informational data bits that characterize the MS/MS spectrum vs peptide match (PSM) for the peptide ID that was clicked in the PTM peptide list table view window. Almost all the information data bits shown in this figure are self-explanatory.
Figure 5.9: Peptide details window #
Tip
The nomenclature of the product ions in the MS/MS spectrum shown in the figure above is simple: when the ion under a given MS/MS spectrum peak is the result of a neutral loss of phosphoric acid, the ion is labelled “yx(-Pz)”, with x being the index of the y ion, and (-Pz) indicating the loss of z phosphoric acid neutral molecule(s).
When ions actually bear any number of post-translational modifications, these are not listed along with the ion series (b or y) and index text because that would quickly become unwieldy, from a graphical point of view.
5.4.1.2 Ambiguities on the post-translational modification sites #
The PTM peptide list table view in Figure 5.7, “PTM peptides list window (first columns)” lists the pepb87b23 peptide ID thrice because that peptide was identified in three different MS/MS scans (see the scan column values for the three rows). What is interesting with these three rows, is that the peptide sequence showing the modification position(s) varies from a row to the other. In one row, the sequence only shows a single red-colored serine residue. That serine was positively identified as a phosphorylated residue. In the other two rows, one serine is red-colored and the other is orange-colored. For these two scans, the position of the phosphorylated residue is not ascertained: the MS/MS data only tell that it is possible that one or the other serine residue be phosphorylated (but not both).
Note
The coloring of these two serine residues is arbitrary in this case: since the PSMs that yielded this same sequence are absolutely identical from a score point of view (when opening the peptide details window, one can check that the Evalues are identical for the two PSMs), the software labels in red the first modification position and in orange all the remaining ones.
When clicking any cell of any one of the two rows where there is an ambiguity over the location of the phosphorylation event, i2MassChroQ shows a contextual menu that displays the possible phosphorylation positions. The user can thus select one or the other of the menu items to display the details of the corresponding peptide.
The ambiguity about the phosphorylation site above, on Peptide ID pepb87b23, is intereresting. Indeed, when the user selects the first item of the contextual menu and then (by keeping the Ctrl key pressed) selects the second item of that menu, the windows that open up show exactly the same informational data bits about the MS/MS scan: the two PSMs were calculated by the search engine on the basis of the very same MS/MS scan (Figure 5.10, “Two mass spectrum vs peptide matches (PSM) in a single MS/MS scan”). This is one reason why both positions could not be ascertained: the engine says that one position is plausible (with a pretty low Evalue) and that the other position is equally plausible (with the exact same low Evalue).
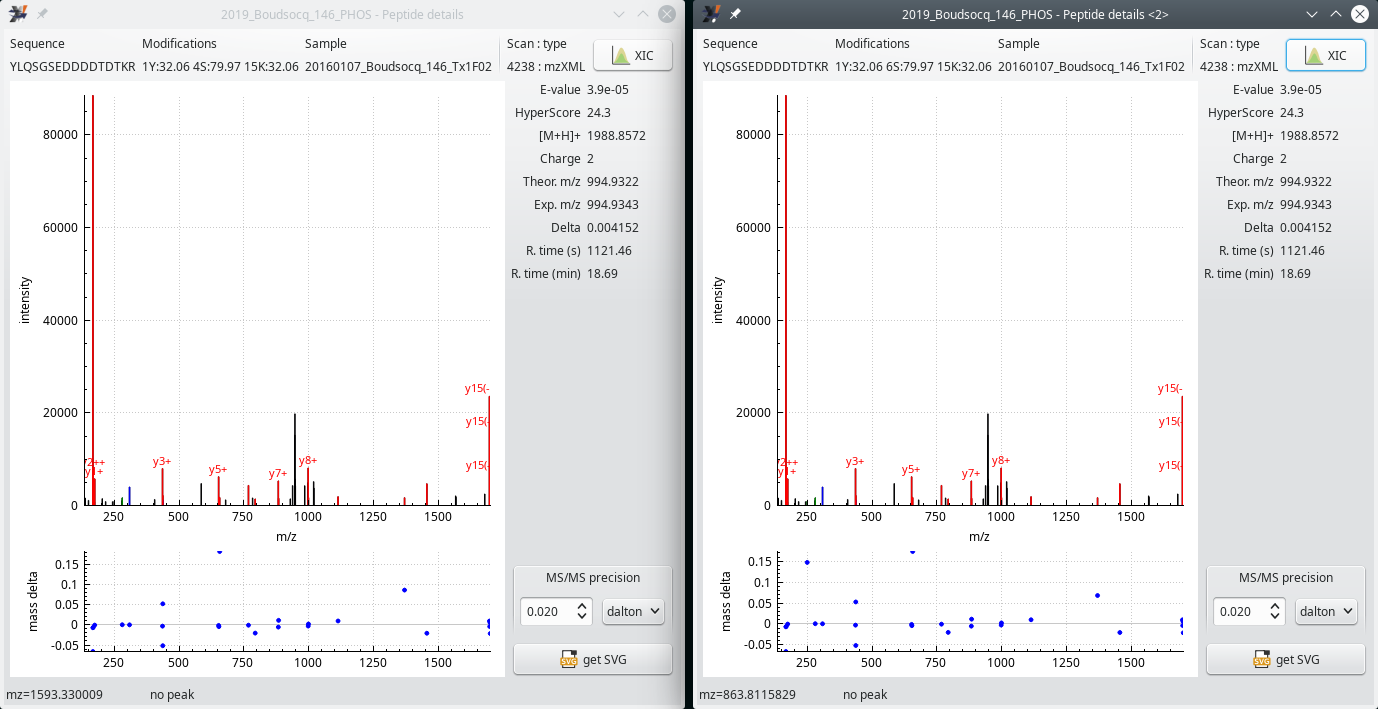
This figure shows the two Peptide details windows that are opened when the user clicks onto the first and the the second menu items of the contextual menu shown in the PTM peptide list window shown in Figure 5.7, “PTM peptides list window (first columns)”. In both windows, the scan number is the same (4238), demonstrating that both PSMs were computed from the same MS/MS spectrum acquisition. Further, the same pretty low E-value should hint at a low reliability of the phosphorylation site identification.
Figure 5.10: Two mass spectrum vs peptide matches (PSM) in a single MS/MS scan #
5.4.1.3 The XIC Viewer Window for the PTM Peptide Details #
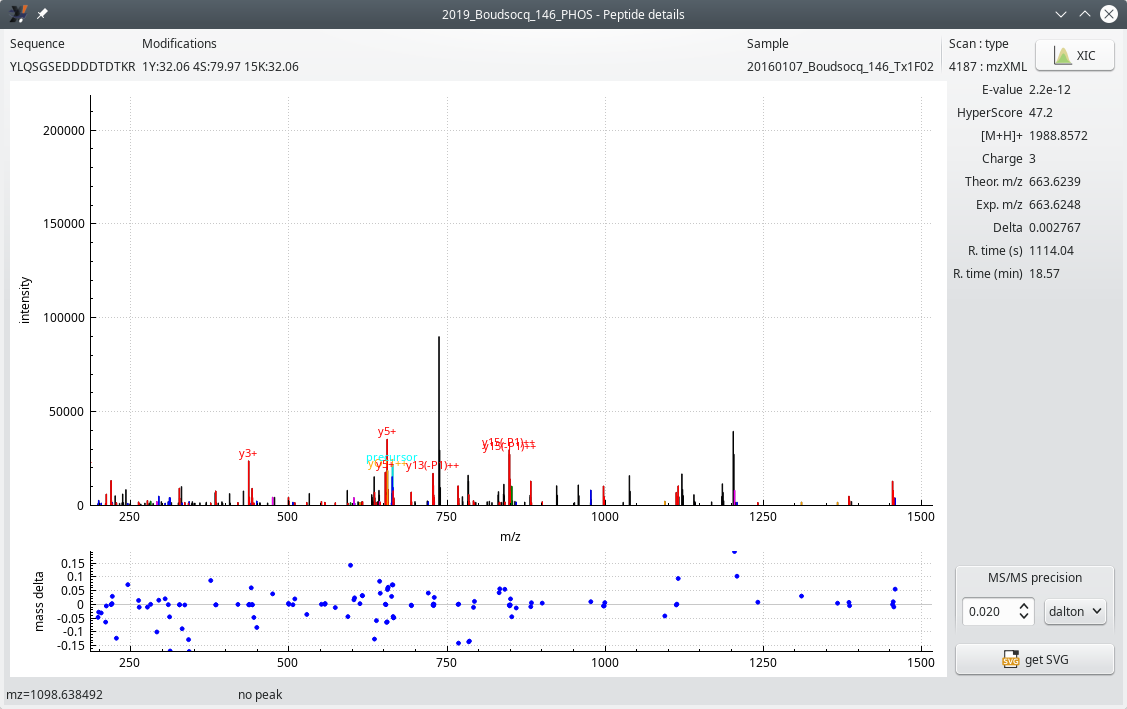
One interesting feature of the Peptide details window, is the XIC button (top right) that triggers the calculation of an extracted ion current chromatogram, as pictured in Figure 5.11, “The extracted ion current (XIC) chromatogram viewer window”. Although very similar to the window described at Section 4.2.3.2, “The XIC Viewer Window for the Peptide Details”, this phospho-proteomics-specific version of the XIC viewer has specific informational data bits described below.
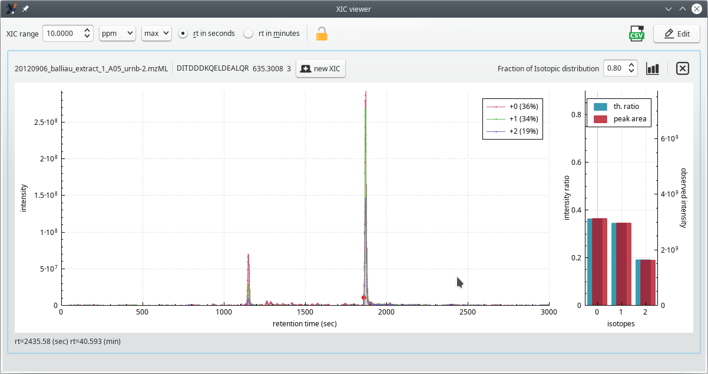
The extracted ion current (XIC) chromatogram viewer shows the peptide sequence interspersed with post-translational modifications data. The modifications are listed as PSIMOD OBO accession number (MOD:xxxxx) text elements[14].
Figure 5.11: The extracted ion current (XIC) chromatogram viewer window #
The phospho-proteomics-specific informational data bits provided in the XIC viewer window (see Figure 5.11, “The extracted ion current (XIC) chromatogram viewer window”) are located right below the top border of the plot frame.
[10] In Orbitrap analyzer-based instrument, HCD stands for “higher-energy C-trap dissociation”. However, a more generic term is oft-used: “higher energy collisional dissociation”.
[11] Boersema et al. 2009. Multiplex peptide stable isotope dimethyl labeling for quantitative proteomics. Nature Protocols.
[12] The data presented in the examples below come from an experiment published in T. Y. Delormel et al. 2022. In vivo identification of putative CPK5 substrates in Arabidopsis thaliana. Plant Science. DOI: https://doi.org/10.1016/j.plantsci.2021.111121.
[13] Here, the page https://www.arabidopsis.org/servlets/TairObject?type=locus&name=AT3G56150 opens in the browser.
[14] Montecchi-Palazzi et al. 2008. PSI-MOD community standard for representation of protein modification data. Nature biotechnol.