i2MassChroQ User Manual
- Preface
- 1 Generalities
- 2 Fundamentals in Bottom-up Proteomics
- 3 The main program window
- 4 Exploring identification data
- 5 Exploring post-translational modification data
- 6 Advanced Proteomics Configurations
- 7 i2MassChroQ and Quantitative Proteomics
- 8 Specific procedures for the timsTOF line of instruments
- A GNU General Public License version 3
4 Exploring identification data
This chapter describes in detail all the steps that the user accomplishes in their data exploration session. The general workflow is to start by looking at a protein identification results window and then by going into the details of the various identifications listed in it. This latter task entails looking into the peptides that provided the protein identification and then looking at the mass spectrum that provided the peptide identification. The mass spectrum, that is, the MS/MS spectrum, has features aimed at allowing the user to make an informed opinion on the validity of the peptide vs mass spectrum match (PSM) at hand. At each moment, it is possible to invalidate a PSM and the identification results are recomputed automatically by taking into account the modification entered by the user.
4.1 The Protein List Window #
When identification results files are loaded, i2MassChroQ automatically performs the protein inference process by using the configuration settings described in Section 3.4.1, “Identification Data Loading Configuration”.
4.1.1 The Protein List Table View #
When the protein inference process is finished, i2MassChroQ displays the protein identifications list in a table view, as pictured in Figure 4.1, “The protein list window”.
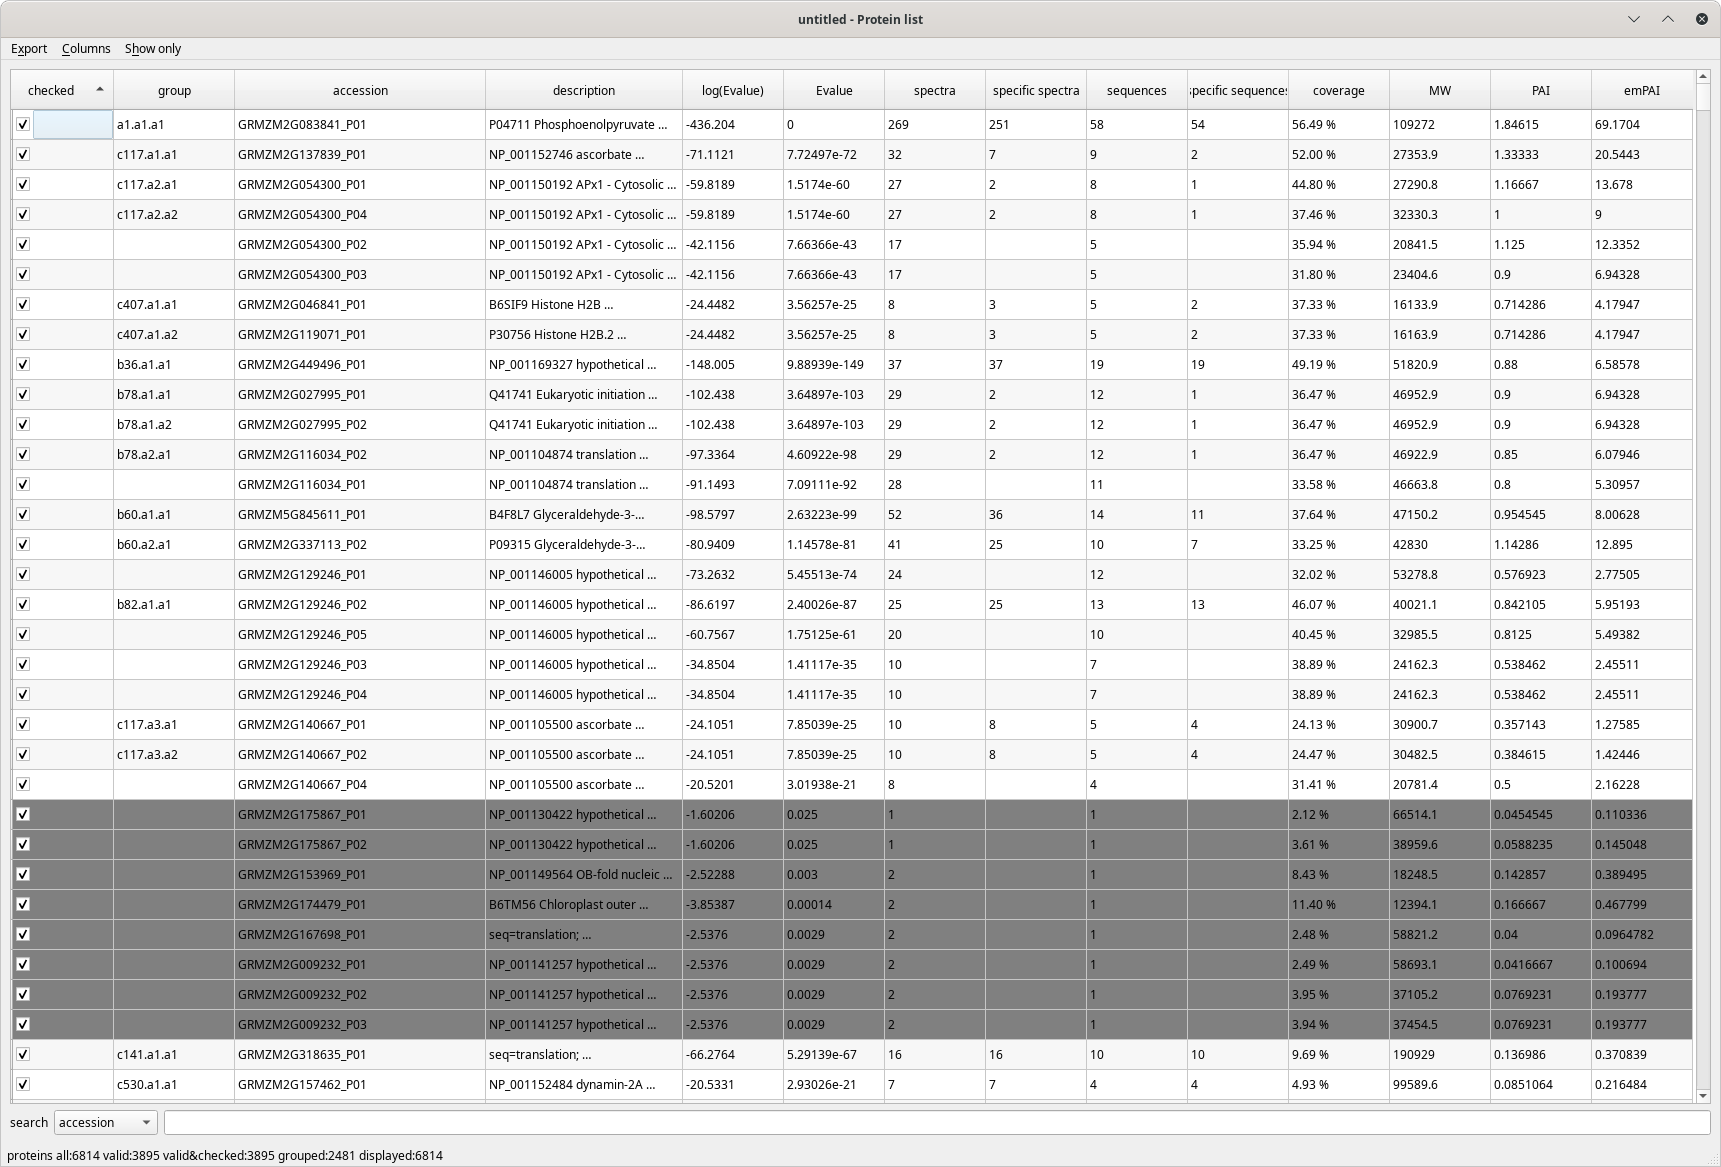
The protein identifications list window displays the proteins assembled into groups. A number of metadata about the identifications are shown in a number of colums, the contents of all of which are described in detail in the text.
Figure 4.1: The protein list window #
The columns that make the protein list table view are detailed below:
Checked: if checked, the identified protein listed on the table row is set to an “accepted” state. By default, all proteins are set to this accepted state. Unchecking a protein determines the protein inference reprocessing, because disregarding a protein modifies the whole protein identifications results set;
group: the group the protein belongs to;
accession: the accession number field of the protein database;
description: the description field in the protein database;
log(E-value): the Log10 of the protein E-value;
E-value: the protein E-value;
spectra: the number of spectra that identified the protein;
specific spectra: the number of spectra that identified only this protein;
sequences: the number of peptidic sequences that can be assigned to this protein;
specific sequences: the number of peptidic sequences that can be assigned only to this protein;
coverage: the percentage of the protein sequence covered by the peptides that identified it;
MW: the molecular weight of the protein (Mr);
PAI: “Protein abundance index”. This index was defined as the “number of peptides identified divided by the number of theoretically observable tryptic peptides”. See https://www.ncbi.nlm.nih.gov/pmc/articles/PMC186633/;
emPAI: “Exponentially modified protein abundance index”. This index was defined as emPAI = 10PAI − 1. See https://pubmed.ncbi.nlm.nih.gov/15958392/.
It is possible to select the columns that must be displayed in the table by checking or unchecking the corresponding item in the menu.
The menu allows one to select the kind of protein items to be shown:
: when checked, the program only shows valid proteins, that is, protein identifications that fullfill the restriction parameters, like protein E-value, for example. These parameters were set at protein identification results loading time but can be modified later;
: show only the proteins that were checked. This setting is useful when the user has unchecked a number of proteins and that they want to regularly keep an eye on them. When proteins are unchecked, the protein inference process is run anew to compute a new grouping by taking not into account the proteins that were disregarded;
: only show the proteins that belong to a group.
The protein identifications list table view above shows greyed protein identities. These are proteins that, by current filter parameters (E-value threshold, for example), are considered not valid.
4.1.2 Operations in the Protein List Window #
The Protein list window houses a number of useful features that let the user scrutinize the protein identifications and also modify the results to suit either more or less stringent filtering parameters.
Searching data in the table view. One interesting feature of the Protein list window is the ability to search through the table's contents using the Search item at the bottom of the window. A number of fields of the protein record, that is, columns in the table view, might be searched.
Dynamic setting of the filter parameters. i2MassChroQ provides a rather high level of flexibility: once a protein identification results set of files has been loaded and that the protein inference process is achieved, the resulting protein groups are displayed in the Protein list window. At this time, the grouping was performed using the parameters set as pictured in Section 3.4.1, “Identification Data Loading Configuration”. It is nonetheless possible to modify these parameters on the fly using the main program window's Filter parameters tab, as pictured in Figure 4.2, “Protein identification filter parameters tab of the main window”.
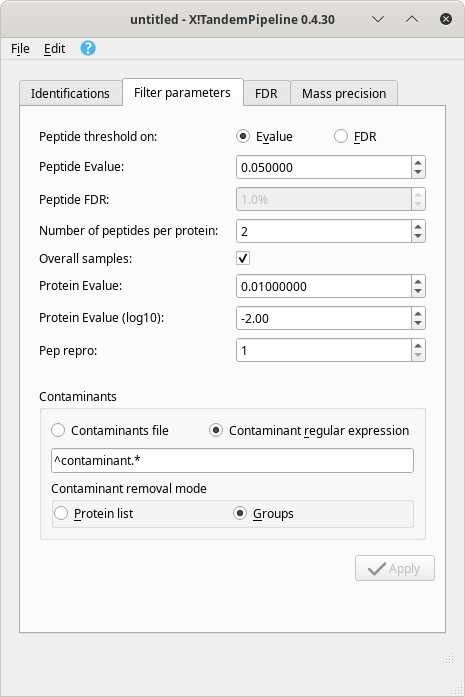
The filter parameters in this dialog box window do mirror the ones that one can set prior to loading protein identification results files. When modified, these parameters elicit a complete run of the protein inference process.
Figure 4.2: Protein identification filter parameters tab of the main window #
Real time update of the false discovery rate. The false discovery rate (FDR) is recalculated at each protein inference process. The data regarding this quality assessment criterion are shown in Figure 4.3, “False discovery rate (FDR) data after a protein inference process is run”.
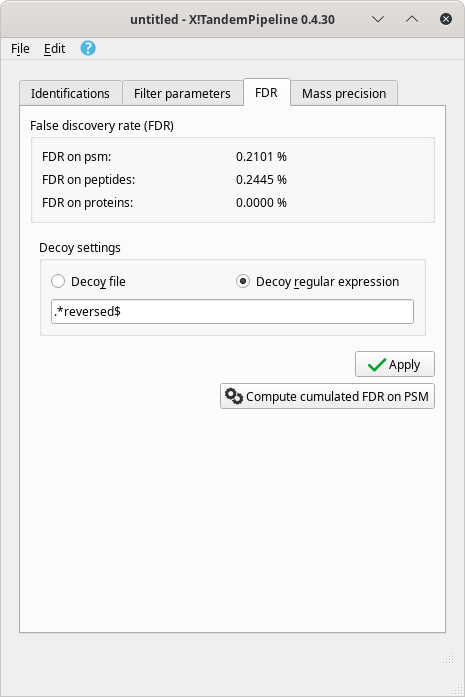
The various data bits about the false discovery rate that is computed each time a protein inference process is run. Note that it is possible to modify the Decoy settings, after which the Apply button triggers the recalculation of the FDR.
Figure 4.3: False discovery rate (FDR) data after a protein inference process is run #
Distribution of mass errors on PSMs plotted in a histogram. It is possible to visualize the distribution of the mass errors over the whole dataset, as pictured in Figure 4.4, “Mass precision quality assessment”. The histogram plots the number of mass spectra that could achieve a PSM against the mass error (mass delta), that is, the difference between the experimental peptide mass and the calculated peptide mass. Figure 4.4, “Mass precision quality assessment”.
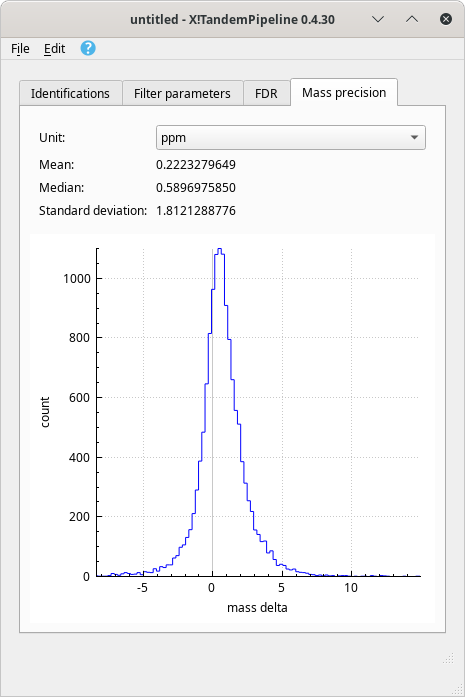
The histogram plots the number of PSMs against the mass error calculated between the experimental mass of the peptide and the calculated mass.
Figure 4.4: Mass precision quality assessment #
The mass delta calculation involves only the peptides that successfully identifed proteins that are currently checked in the protein identification list and that satisfy the filter parameters. The proteins identified in the decoy database are not processed. The unit of the mass delta may be selected using the Unit drop-down list. Two units are available: ppm (for part-per-million) or Dalton.
Exporting the final protein identifications list to a spread sheet. Once all the proteins in the identifications list have been properly checked, the user might export the data set to an OpenDocumentFormat (ODF) spread sheet file using the menu item of the main window's menu.
4.1.3 Delving Inside the Protein Identification Data #
The protein list table view, as pictured in Figure 4.1, “The protein list window” is actually an active matrix in which the user can easily trigger the exposition of the data that yielded any protein identification element of the table. This is simply done by clicking onto any cell of the table at the row matching the protein for which scrutiny of the data is desired.
Depending on the column at which the mouse click happens, there might be two different windows showing up:
The Protein details window, showing the sequence of the protein, the matching peptides and other informational data bits, as pictured below:
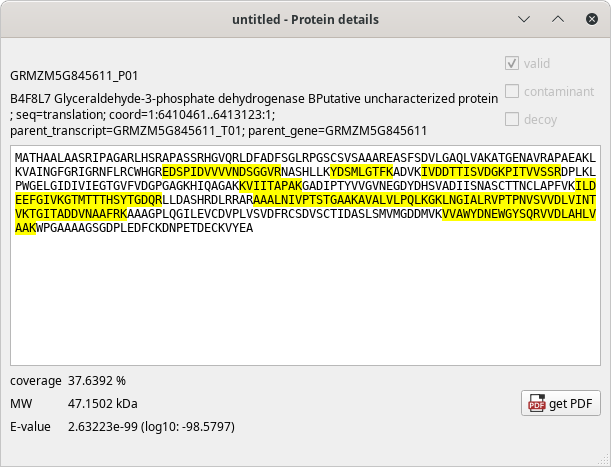
When one cell in the Accession, Description or Coverage column is clicked, this window shows up and displays the sequence of the protein, the coverage of the peptides and other useful data.
Figure 4.5: Protein details window #
When one cell in any one of the remaining columns is clicked, the window that shows up is the Peptide list window showing a list of all the peptide identifications, to be described in the next section.
Tip
When clicking one cell in one column and one given row, the corresponding window shows up, if one was not already open. If one window is already open, no other window shows up, but the existing window has its data updated to match the new protein row being clicked on.
It is possible to have multiple windows opened at a time by clicking a new row while maintaining the Ctrl key pressed.
4.2 The Peptide List Window #
The Peptide list window displays all the data in a table view similar to the one used to display the protein list described in the previous sections.
4.2.1 The Peptide List Table View #
The Peptide list table view has a pretty large number of columns to display all the data about each peptide that identified a given protein. These columns are described in the following figures.
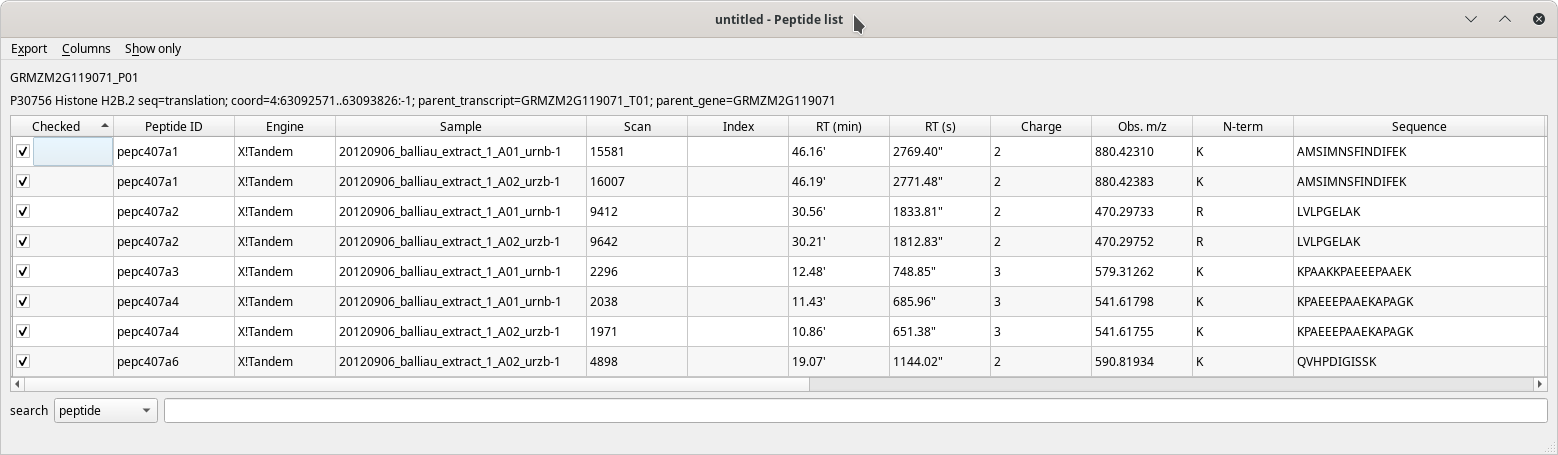
The Peptide list table view has many columns (first columns).
Figure 4.6: The peptide list window (first columns) #
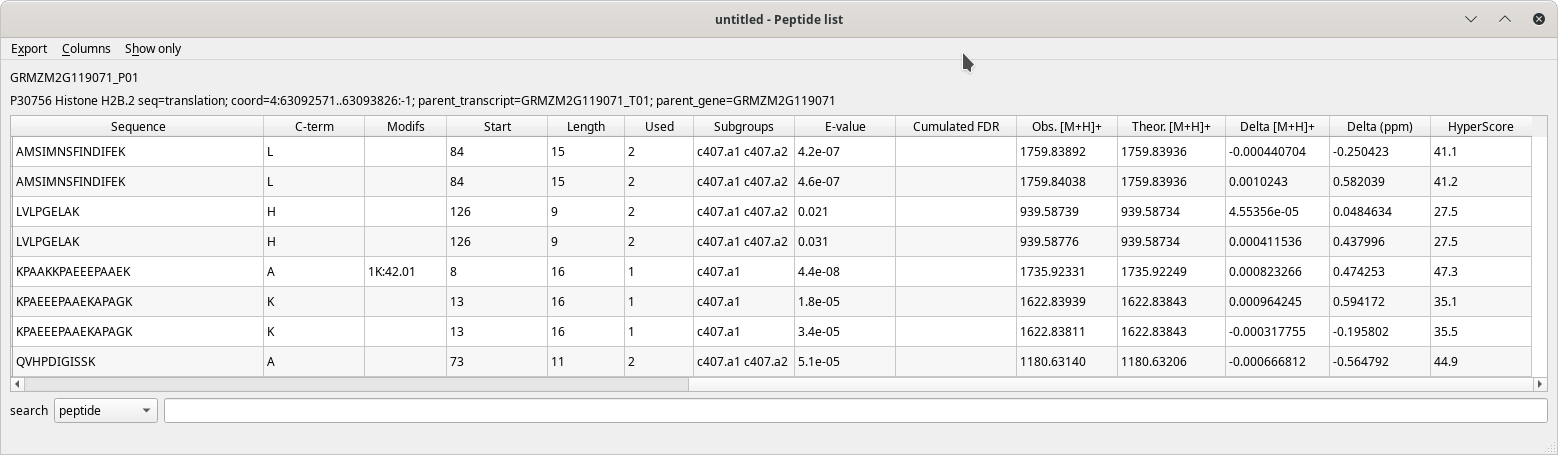
The Peptide list table view has many columns (last columns).
Figure 4.7: Peptide list window (last columns) #
The table's contents are well described by the column headers that are self-explanatory. When hovering over a column header with the mouse cursor, a tool-tip explanatory text is displayed.
It must be noted that more columns might make the table view depending on the protein identification data that were loaded. Indeed, depending on the database searching engine that was used for the protein identification, the data to be displayed vary. The whole list of columns that might be displayed in the table view are pictured in Figure 4.8, “Columns that populate the peptide list table view”
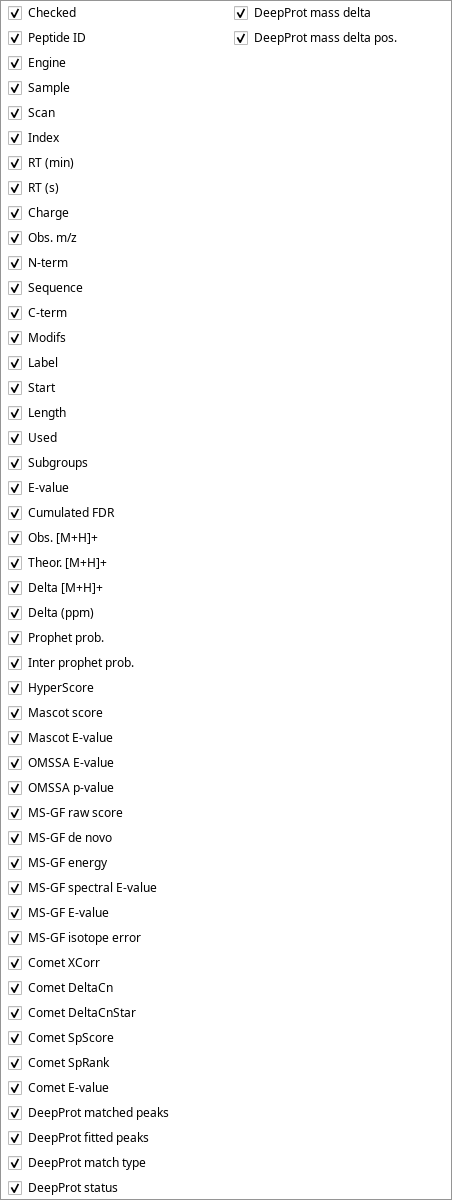
Depending on the provenience of the protein identifications (the database search engine), the columns that are part of the table view differ. This full list is displayed when selecting the menu.
Figure 4.8: Columns that populate the peptide list table view #
4.2.2 Operations in the Peptide List Window #
The Peptide list window houses a number of pretty interesting features that let the user scrutinize the peptide details.
Searching data in the table view. One interesting feature of the Peptide list window is the ability to search through the table's contents using the Search item at the bottom of the window. A number of fields of the protein record, that is, columns in the table view might be searched.
Exporting the final protein identifications list to a spread sheet. Once all the peptides in the identifications list have been properly checked, the user might export the data set to an OpenDocumentFormat (ODF) spread sheet file using the menu item of the main window's menu.
4.2.3 Delving Inside the Peptide Identification Data #
The Peptide list table view, as pictured in Figure 4.6, “The peptide list window (first columns)” is actually an active matrix in which the user can easily trigger the exposition of the data that yielded any peptide identification element of the table. This is simply done by clicking onto any cell of the table at the row matching the peptide for which scrutiny of the data is desired.
4.2.3.1 The Peptide Details Window #
When clicking any one of the cells of the peptide list table view, one window shows up that details the various data elements for the peptide documented in the table row. The window is pictured in Figure 4.9, “Peptide details window”.
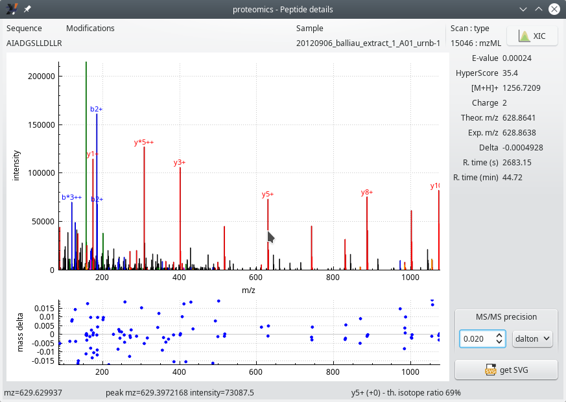
This window displays the MS/MS spectrum that allowed identifying a peptide (that is, a PSM). A number of informational data bits are displayed, like the MS/MS scan number, the E-Value for the peptide, along with its Hyperscore, for example (see text below for a thorough description).
Figure 4.9: Peptide details window #
In Figure 4.9, “Peptide details window”, the two graphs show the following:
The top graph displays the mass spectrum of this PSM. This MS/MS spectrum has its recognized peaks in the b and y ion series labelled in blue and red respectively. When the mouse cursor hovers over a mass peak, the details of that mass peak are printed in the status bar of the window (bottom line).
Navigating the spectrum is straightforward: to zoom/unzoom in a given area of the spectrum, point the mouse cursor at the peak of interest and use the mouse wheel to zoom/unzoom. To modify the ordinate intensity scale, click onto the axis and drag the mouse upwards or downwards.
The bottom graph plots—for each matching MS/MS peak (that is, b and y ion series)—the mass difference (mass delta) between the ion's measured mass and the theoretical mass. In this example, we see that the y ion series is moderately matched (large error range).
It is possible to set the MS/MS precision to a determinate value and unit (Dalton, ppm or res). The value entered in the spin box widget modifies the assignement of the fragmentation peaks.
Tip
The MS/MS spectrum mass peaks are annotated using the following naming convention:
*: neutral NH3 loss;
o: neutral H2O loss;
The ion charge is displayed in the form of “+” or “++” text strings.
The right hand side margin of the window provides a number of data about the PSM, like the peptide E-value, the HyperScore, the ion charge, the theoretical and experimental masses, the difference between the two, the retention time at which this ion was detected… These informational data bits are self-explanatory.
The XIC button at the top right corner of the window triggers the calculation of the extracted ion current chromatogram, as described in the section below.
4.2.3.2 The XIC Viewer Window for the Peptide Details #
One interesting feature of the Peptide details window, is the XIC button (top right) that triggers the calculation of an extracted ion current chromatogram, as pictured in Figure 4.10, “The extracted ion current (XIC) chromatogram viewer window”.
Tip: What is a XIC chromatogram?
The notion of extracted ion current chromatogram is best explained by describing the computation that yields that chromatogram.
The user defines the m/z value for which the chromatogram is to be determined. The program iterates in each MS spectrum (that is, full scan spectrum) and looks if an ion by that m/z value was encountered. If so, a variable holding the cumulated intensity of that ion is incremented for the retention time at which the mass spectrum was acquired. For example, if m/z value 1254.25 is searched for, and an ion of that m/z value is found in the mass spectrum acquired at retention time 2.5 min, then a tuple variable is stored like this: (2.5, intensity). Then, another mass peak by that m/z value is found in mass spectrum acquired at retention time 47 min, for which another tuple is created: (47, intensity).
If the data are from ion mobility—mass spectrometry (IM-MS) experiments, there might be a large number of spectra acquired at a given retention time. For example, data from the Waters Synapt2 instrument have 200 spectra acquired for any given retention time value (the spectra are drift-related spectra). In Bruker timsTOF data, there are more than 700 spectra acquired at any given retention time. Thus, the searched m/z value might be found more than once for a retention time value. In this case, the tuple's intensity value is incremented by the intensity of the new peak of the m/z value at that specific retention time value.
When the program has finished iterating in all the mass spectra of the acquisition, it plots the XIC chromatogram as intensity=f(retention time). This is the reason why it is considered a chromatogram.
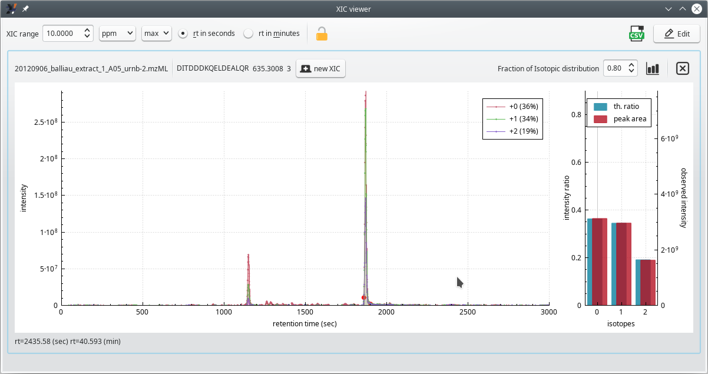
The extracted ion current (XIC) chromatogram viewer is useful to scrutinize the mass data at the very origin of a PSM. It is routinely used to ensure that the PSM is faithful. If not, the corresponding peptide can be unchecked from the peptide identifications list table view. As a response, the protein inference process is run anew.
Figure 4.10: The extracted ion current (XIC) chromatogram viewer window #
The XIC viewer window displays the “guts” of the of MS spectrum of the precursor ion that was fragmented and that yielded a PSM. The XIC chromatogram (left plot panel) is actually a set of XIC chromatograms that are superimposed in the plot widget (see Figure 4.11, “The extracted ion current (XIC) chromatogram viewer window (zoomed view)”). One of the traces (legend +0) is for the first peak of the isotopic cluster of the searched ion; the second trace (legend +1) is for the second peak of the isotopic cluster. Likewise for the third trace. In the typical informatics-oriented style of numbering, the first isotopic peak (only light isotopes enter in the composition of the peptidic ion), is “isotope 0”; the second isotopic peak (one light isotope is substituted with a heavy one) is “isotope 1” and, finally, the third isotopic peak (two light isotopes were replaced by heavy ones) is “isotope 2”.
The right panel is a bar plot showing —for each one of the isotopes— a comparison between the experimental peak area and the computed probability of the corresponding isotope peak. In the example, the match between the experimental and the theoretical cluster shape is perfect. This scrutinization of the data is very useful when one wants to double-check the quality of a protein identification on the basis of a given PSM.
Note
The theoretical isotopic cluster peaks are calculated using the formula of the peptide that has been identified in the PSM for which the XIC chromatogram is being requested.
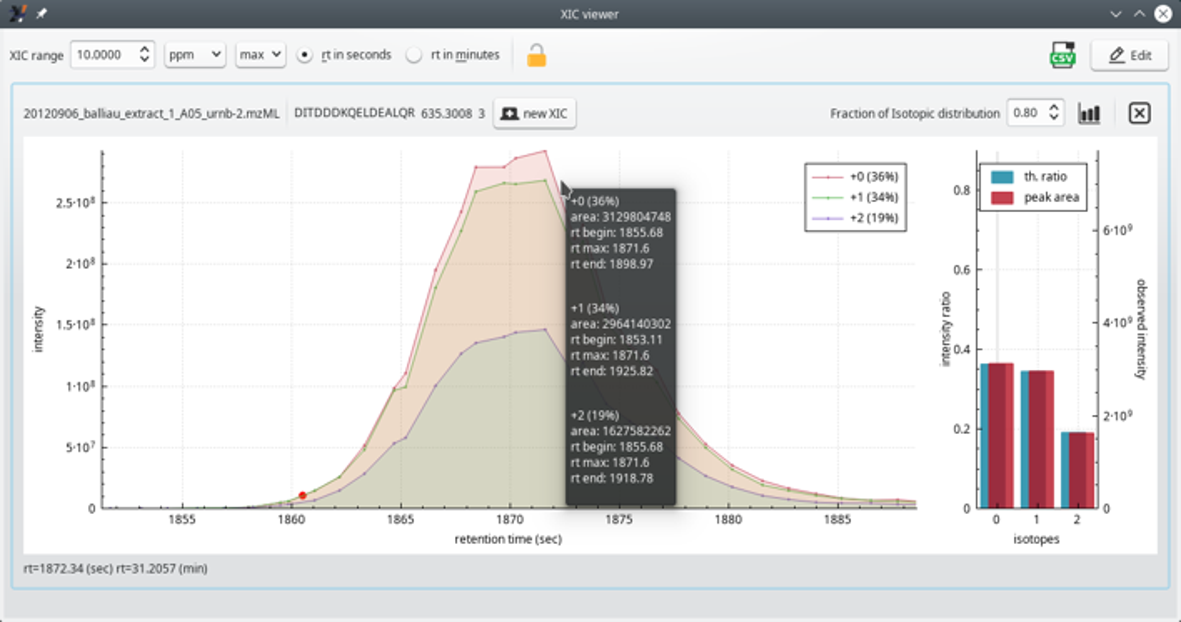
Zoomed in view of the three XIC chromatogram plots in the left hand side plot widget.
Figure 4.11: The extracted ion current (XIC) chromatogram viewer window (zoomed view) #
Another interesting bit of information is the Fraction of Isotopic distribution (spin box widget top right corner of the window). This one needs some background. When one has a peptide formula and the peptidic ion charge, one can calculate the theoretical isotopic cluster corresponding to that specific ion. The calculation is CPU-intensive and sometimes one would like to limit its duration. This is possible by indicating that one is interested, for example, in only the 80 % of the total isotopic peaks that one would effectively find (even in minute amouts) in nature. This value tells exactly that. The calculation displayed in the window, encompassing only 80 % of the whole natural span of the isotopic cluster, yields a calculated cluster made of only three isotopic peaks. If the user had set the value to 99 %, then, most probably, numerous other isotopic peaks of very low intensity would have been calculated on the right hand side of the isotopic cluster (heavier ions because more heavy isotopes are included in the computation).
Remember to click onto the “Histogram plot” button next to the spin box widget for the new Fraction of Isotopic distribution value to take effect.
As for the previous MS/MS spectrum plot, to zoom in/out regions of the XIC chromatogram plot widget, hover the mouse cursor over the region of interest and rotate the mouse wheel.
4.3 Handling Phospho-Proteomics Data #
i2MassChroQ is able to cope with phospho-peptides. The mass spectrometric data are acquired exactly as usual with the mass spectrometer, but the sample preparation goes along theses steps:
Separate digestion of the samples (when there are more than one);
Labeling of the peptides, each sample gets a different label;
Pool of the whole set of peptides into a single mixture;
Separation of the peptides on a strong cation exchange (SCX) resin, collection of the fractions;
Phospho-peptide enrichment using IMAC[9] for each SCX fraction. The SCX fraction is loaded onto the IMAC resin and, following a wash step, the phospho-peptides are eluted (pH-based elution). There is thus a one-to-one relation between a SCX fraction and an IMAC-based purification fraction.
Mass spectrometric analysis of each IMAC-based phospho-peptide-enriched fraction.
X!Tandem needs to be configured in such a manner that it can generate all the theoretical peptides (and fragments) that might bear the phosphoryl group. This process is described in the section below.